

Introduction
If you spend enough time around trading content online, you will eventually hear the term “technical analysis.” For many beginners, it sounds complicated, advanced, and something only professional traders understand, but it is much simpler than you think.
Technical analysis is the process of studying price charts to identify trends, patterns, and potential trading opportunities. Instead of trying to predict the economy or analyze financial statements, technical traders focus primarily on price movement itself. The idea is that by understanding how markets behaved in the past, traders can make more informed decisions about what may happen next.
For short-term traders, especially futures traders, technical analysis is one of the most widely used trading methods in the world. It helps traders identify entries, exits, trend direction, momentum, and areas where buyers and sellers are likely to react. More importantly, technical analysis gives traders structure. Instead of entering trades emotionally or randomly, traders can begin building a repeatable process based on probabilities and market behavior.
At OneUp Trader, technical analysis plays a major role in how the majority of traders approach futures markets and funded trader programs. While no strategy guarantees profits, understanding how to read charts and recognize patterns can help traders develop consistency, discipline, and risk management skills over time.
In this guide, we’ll break down exactly what technical analysis is, how it works, the tools traders use, common beginner mistakes, and how traders can start applying technical analysis at the OneUp Trader evaluation.

What Is Technical Analysis?
Technical analysis is the study of historical price movement using charts, patterns, indicators, and market data to identify potential future price direction. In simple terms, technical traders believe that past price behavior can provide clues about what the market may do next.
Rather than focusing heavily on external factors like company earnings, economic reports, or balance sheets, technical analysts primarily study price action, trends, volume, support and resistance levels, and momentum. For example, if a market repeatedly struggles to move above a certain price level, traders could identify that area as resistance. If buyers consistently step into the market at a specific level, that area can become support.
Technical analysis is especially popular among day traders, swing traders, scalpers, and futures traders because short-term market movements are often heavily influenced by momentum, liquidity, trader psychology, and supply-and-demand dynamics.
While technical analysis does not predict the future with certainty, it helps traders build a framework for making decisions based on probability rather than emotion.
Technical Analysis vs Fundamental Analysis
One of the first things beginners learn is that there are two major ways traders analyze financial markets: technical analysis and fundamental analysis.
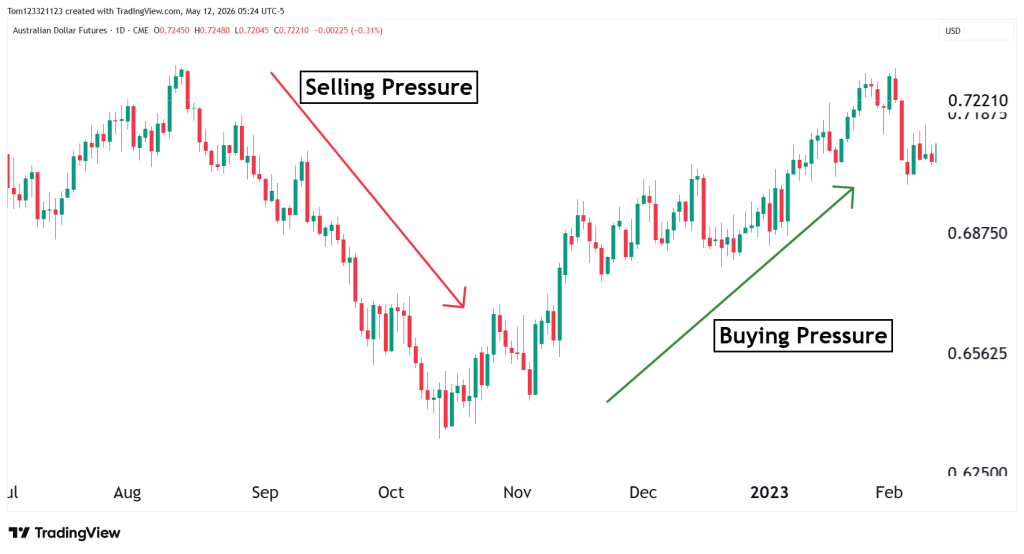
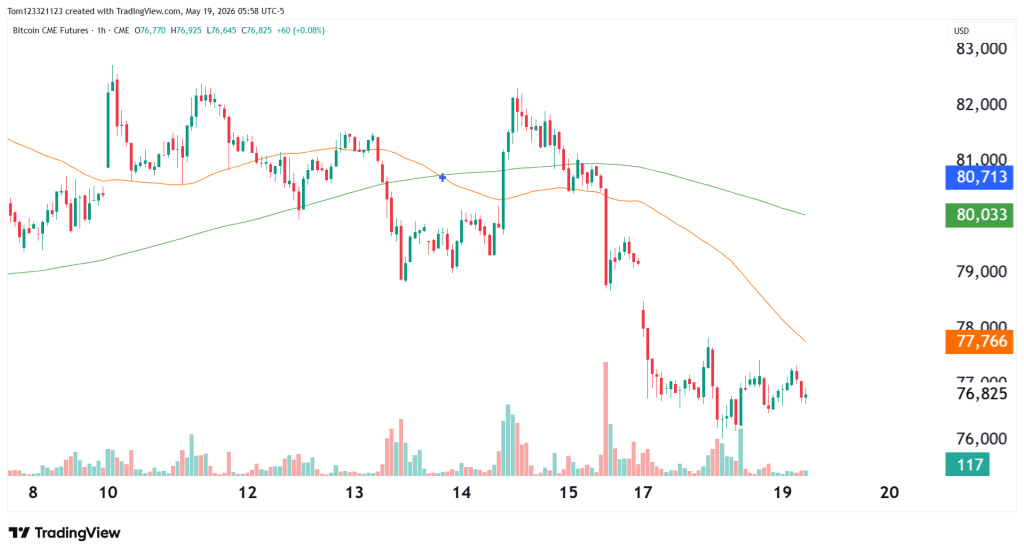
Technical analysis focuses on charts, price movement, trends, volume, and momentum as seen in the chart below:
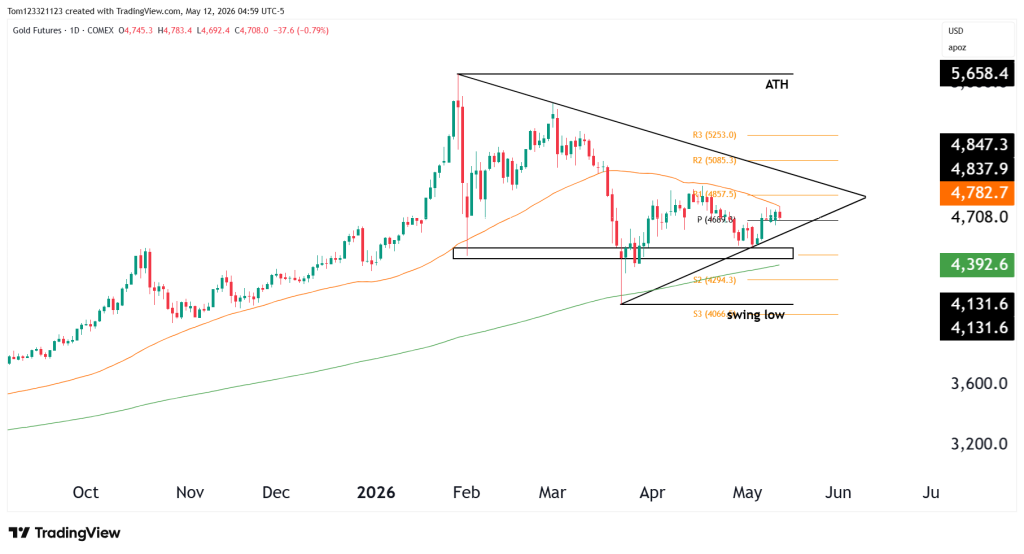
A technical trader may enter a trade because a breakout occurs, momentum increases, or a key support level holds. Fundamental analysis, on the other hand, focuses on economic data, earnings reports, interest rates, inflation, and other financial conditions.
A fundamental trader may buy a market because inflation is slowing or economic conditions support growth, while a technical trader may buy simply because the chart shows strong momentum and buyers stepping into the market. Trading based solely on fundamentals is usually preferred by long-term traders and investors.
The two approaches are not mutually exclusive however, and many traders combine both. However, technical analysis tends to dominate short-term futures trading because markets move quickly and traders need structured ways to react in real time.
This is one reason many funded traders rely heavily on technical analysis during evaluations. It helps create clear rules, trade plans, and risk management structures that can be repeated consistently.
Why Technical Analysis Is Important In Trading
One of the biggest misconceptions beginners have is that successful trading requires predicting every market move perfectly. In reality, trading is largely about probabilities and risk management. A trader with a solid trading plan and the discipline to follow it can do very well in financial markets.
Technical analysis helps traders identify trends, recognize momentum, plan entries and exits, and manage risk more effectively. Without structure, trading often becomes emotional. Traders chase price movement, enter impulsively, hold losses too long, or overtrade after a losing streak.
Technical analysis helps reduce that randomness by giving traders a criteria for decision-making. For example, instead of buying simply because the market is moving higher, a trader may wait for a breakout above resistance, confirmation from volume, or a pullback into support before entering a position.
Over time, building a repeatable process becomes one of the most important steps toward becoming consistently profitable. This is especially important for funded traders because evaluations reward discipline and consistency rather than reckless trading.
The 3 Core Principles of Technical Analysis
Technical analysis is built around three foundational principles that traders have followed for decades.
Price Discounts Everything
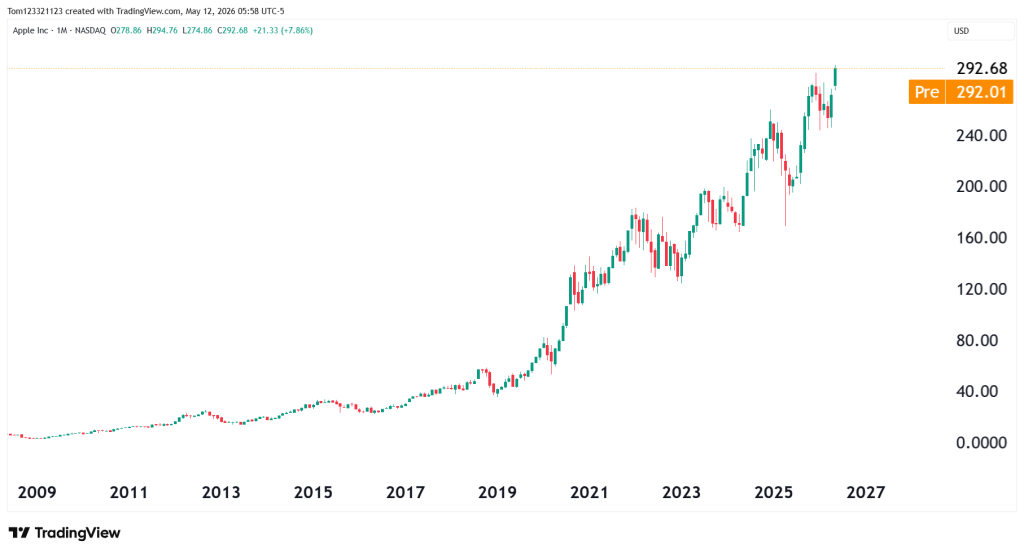
This principle means that all known information is already reflected in the current market price. That includes news, economic data, earnings reports, trader sentiment, and geopolitical events. If you have heard the saying, ‘the market is never wrong.’ This is exactly what it means, that everything is already reflected in the price. Markets move based on expectations not on what is happening now. For example, Apple stock rallies because investors believe that it will continue to grow in the future, not now. If they expect growth for the short term, but not in the long term, then we would see the price of Apple stock fall. This is why stocks trade at high multiples on their earnings.
Apple’s P/E ratio has averaged 25 over the past 20 years. This means investors are willing to pay 25 times what it currently earns for the stock, and this is a big reason why the price goes up.
History Repeats Itself
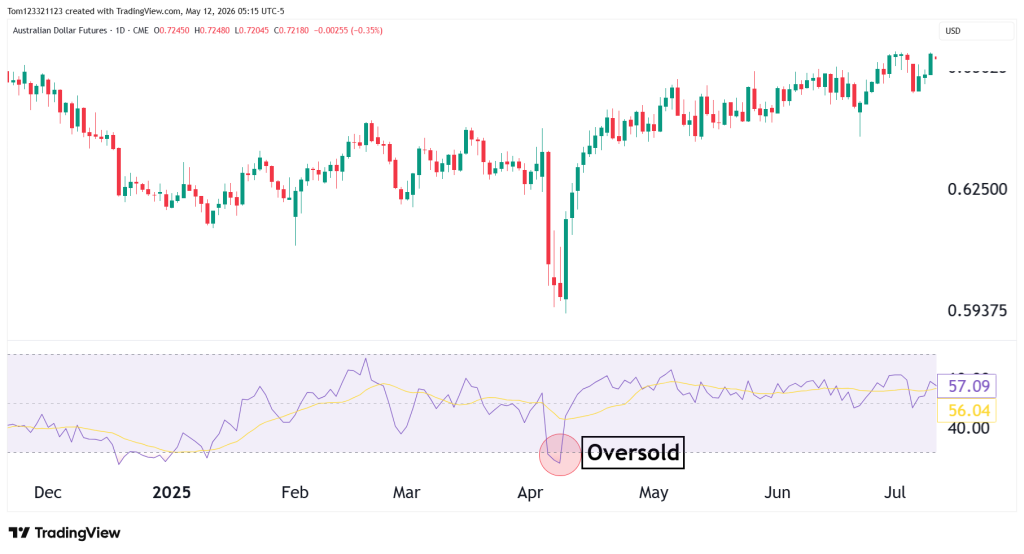
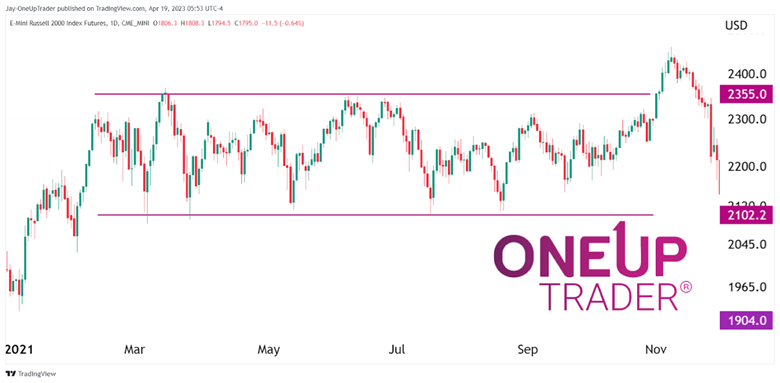
This is not consistent all the time, Markets are heavily influenced by human psychology. Fear, greed, panic, optimism, and herd behavior all contribute to repeating market patterns over time. Technical traders can take advantage of these inconsistencies by using indicators to sell when the market is overbought and buy when it is oversold. (See the chart below).
Markets Move In Trends
Markets rarely move in perfectly random directions. Instead, they often trend upward, downward, or sideways for extended periods.
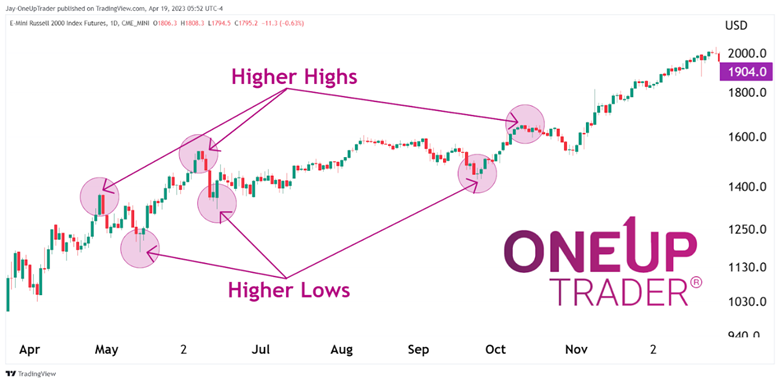
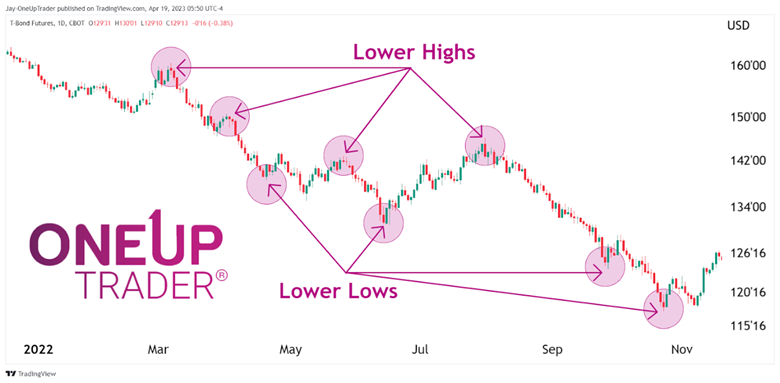
An uptrend forms when price creates higher highs and higher lows, while a downtrend forms when price creates lower highs and lower lows. Technical traders generally prefer trading with the trend because momentum often continues longer than many traders expect.
Learning how to identify trends is one of the first major skills beginners develop when studying technical analysis.
Types of Charts Used In Technical Analysis
Charts are the foundation of technical analysis because they visually display price movement over time. There are several chart types traders use, but candlestick charts are by far the most popular.
Candlestick charts display the opening price, closing price, highest price, and lowest price during a specific period of time. Traders use them because they quickly reveal momentum and market sentiment. For example, strong bullish candles mean there is strong buying pressure, while long bearish candles can indicate strong selling momentum.
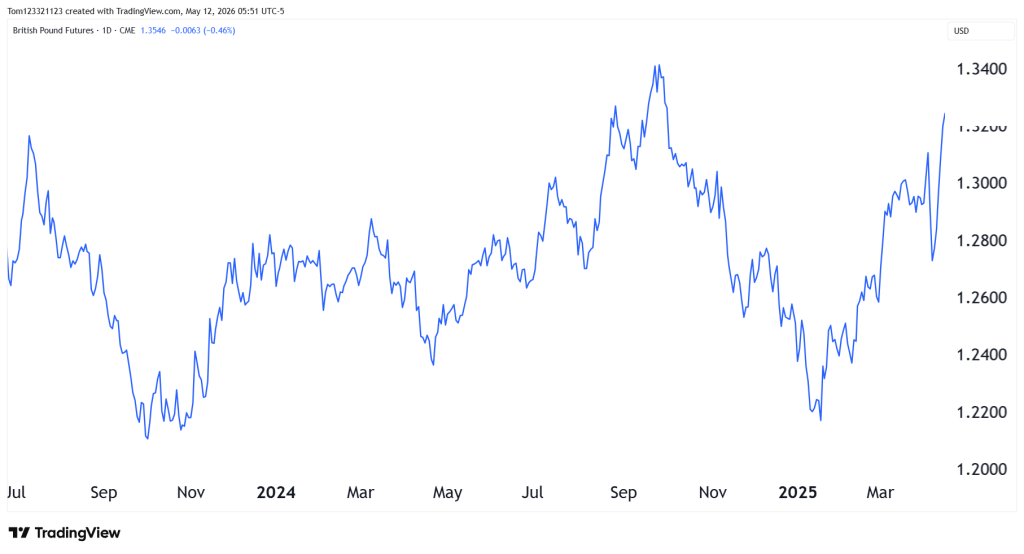
Line charts are much simpler and connect closing prices over time using a single line. They are often used for identifying broader trends but provide less detail than candlestick charts.
Bar charts contain similar information to candlestick charts but are visually less popular among modern retail traders.
For most beginners learning technical analysis, candlestick charts become the primary charting method because they provide the clearest picture of short-term price behavior.
Understanding Trends
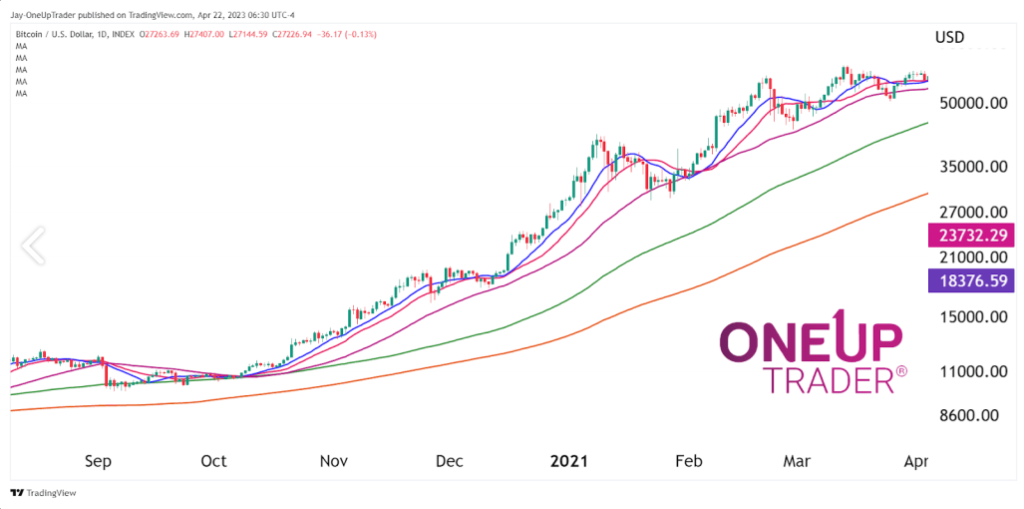
Trend analysis is one of the most important concepts in technical analysis because markets tend to move directionally over time. Look at the chart below and notice how, even though there are periods of time when the market pulls back, the dominant trend is up.
An uptrend occurs when price consistently creates higher highs and higher lows, signaling buyers remain in control. A downtrend occurs when price creates lower highs and lower lows, meaning sellers are dominating the market.
Sometimes markets move sideways without a clear directional trend. These periods are known as consolidations or ranging markets and often occur before larger breakouts or trend continuation moves.
Understanding trend structure helps traders avoid fighting momentum. One of the most common mistakes beginners make is constantly trying to predict reversals instead of trading with the prevailing market direction.
In many cases, simply learning how to identify trends well can significantly improve trading decisions.
Support and Resistance
Support and resistance are two of the most widely used concepts in technical analysis because they help traders identify areas where price may react.
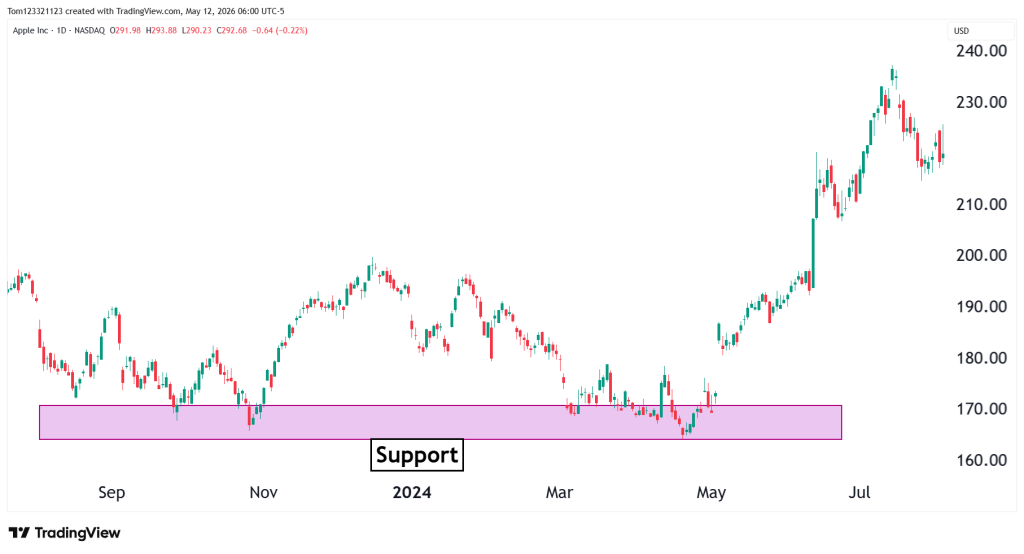
Support is a price level where buyers tend to step into the market and prevent price from falling further. Traders often describe support as a “floor” beneath the market because price repeatedly reacts there before moving higher again.
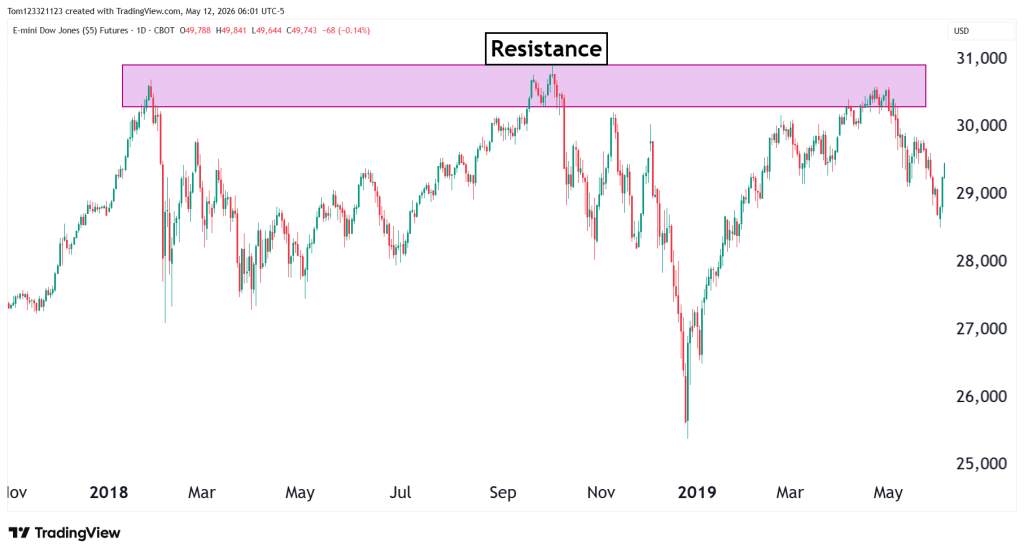
Resistance works the opposite way. It is a price level where sellers tend to enter the market and prevent price from moving higher. Resistance acts like a ceiling above price.
These levels are important because they help traders:
- identify potential entries
- locate stop-loss placements
- recognize breakout opportunities
- manage risk more effectively
For example, if a market repeatedly bounces from the same support level, traders could look for buying opportunities when price tests it again. If price breaks above resistance with strong momentum and volume, it is a breakout.
Volume In Technical Analysis
Volume measures how much buying and selling activity occurs during a given period. Many traders consider volume extremely important because it helps confirm price movement.
For example, if a market breaks above resistance with strong volume, the breakout is more reliable because increased participation supports the move. On the other hand, weak volume during a breakout could mean the move lacks conviction and could fail.
Volume can also help traders identify momentum shifts, exhaustion, institutional participation, and breakout strength. In futures trading, especially, volume analysis becomes very important because highly liquid markets often react aggressively around major economic events and key technical levels.
Traders combine volume with price action to better understand what the market is doing behind the scenes. It also adds a layer of conviction to trends and breakouts. The purpose of this article is not to explain how to use volume in trading, but how useful it can be. Using this indicator correctly can have a huge impact on the success of a trading strategy.
Moving Averages
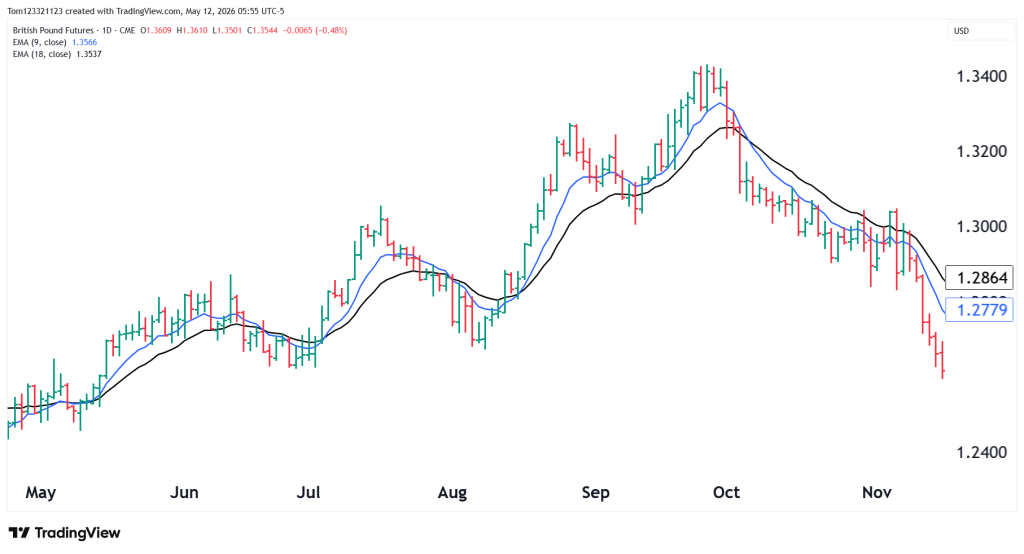
Moving averages are among the most popular indicators used in technical analysis because they help smooth out short-term price fluctuations and make trends easier to identify.
A moving average calculates the average price over a specific period of time. Common moving averages include the 20 EMA, 50 SMA, 100 SMA, and 200 SMA.
Traders use moving averages to identify trend direction, confirm momentum, locate dynamic support and resistance, and filter out market noise. For example, if price remains above a moving average for an extended period, traders may interpret that as bullish momentum.
Take A Look At Our In Depth Guide On Moving Averages Below
While moving averages can be useful tools, beginners should avoid relying on indicators alone for decision-making. Indicators are best used as supporting tools alongside price action, market structure, and risk management.
Common Chart Patterns
Chart patterns are one of the most recognizable parts of technical analysis because they visually represent recurring market behavior.
A double top forms when price tests a resistance level twice and fails to break higher, signaling weakening momentum and a reversal. A double bottom forms when price tests support twice before moving higher, telling us that buyers are defending the level.
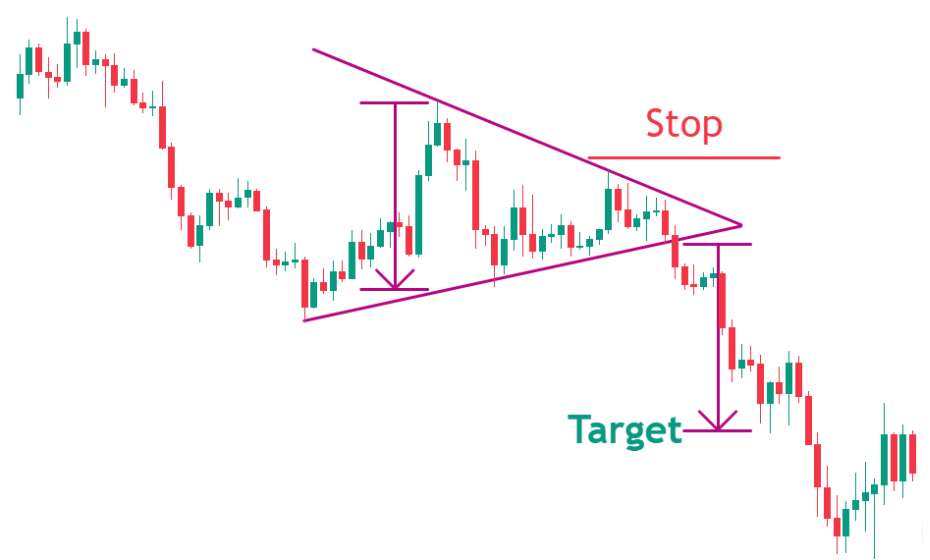
Triangle patterns occur when price compresses into a narrowing range and often lead to breakout moves once volatility expands.
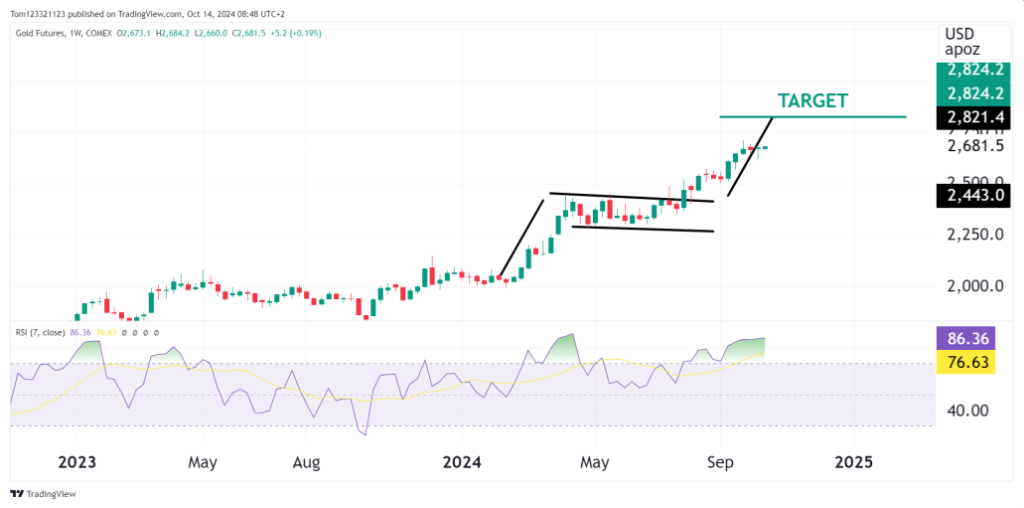
Flag patterns are continuation formations that appear after strong directional moves and may indicate the market is pausing before continuing higher or lower.
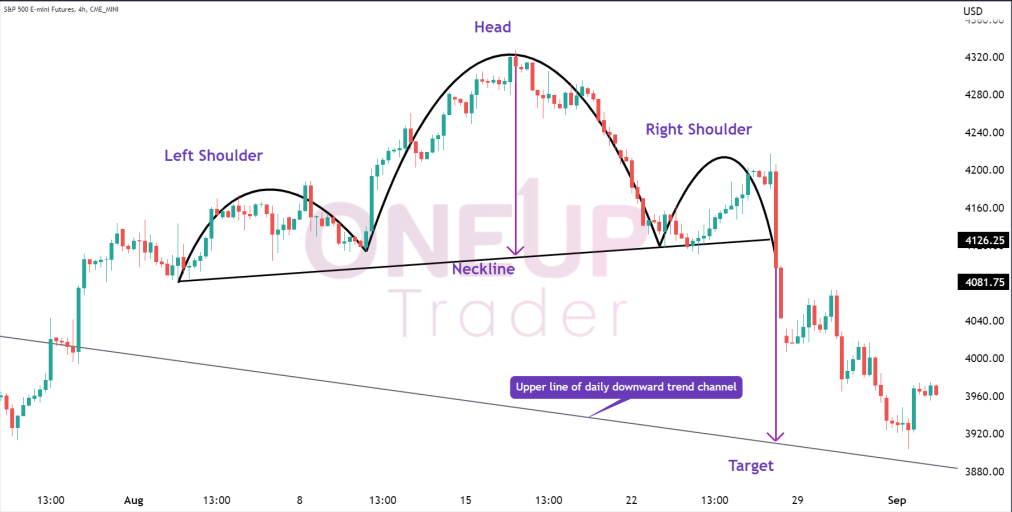
One of the most famous reversal patterns is the head and shoulders formation, which usually signals a trend is weakening before reversing direction.
No chart pattern works perfectly every time, but traders use them to identify high-probability setups and improve trade planning. The key here is that these patterns repeat over time and thus, if traded correctly give an edge trading them multiple times. Trading is all about probabilities and finding patterns that repeat themselves is how traders find an edge and build a trading plan.
Why Technical Analysis Works
Technical analysis works largely because financial markets are driven by human behavior. Fear and greed influence nearly every market, causing traders to react emotionally during rallies, selloffs, and periods of uncertainty.
These emotional reactions create repeating behaviors and price patterns over time. Technical analysis attempts to identify these recurring behaviors through price movement, volume, momentum, and market structure.
In many ways, charts become a visual representation of crowd psychology. Panic selling can create sharp breakdowns, fear of missing out can accelerate breakouts, and profit-taking often creates resistance levels.
Because these behaviors repeat across different markets and timeframes, technical traders focus on identifying probabilities rather than certainties.
Common Mistakes New Traders Make
Most beginners struggle with technical analysis initially not because the concepts are impossible to learn, but because they often overcomplicate the process.
One of the most common mistakes is using too many indicators. New traders often fill charts with dozens of indicators searching for perfect signals, but this usually creates confusion rather than clarity. In many cases, simple chart analysis is more effective.
Another major mistake is ignoring risk management. Even strong technical setups can fail, and without proper risk control, a few losing trades can quickly damage an account.
Overtrading is another common issue. Many beginners believe they need to trade constantly to make money, but patience is often one of the most important skills in trading. Waiting for quality setups is usually far more effective than forcing trades.
Revenge trading after losses is also extremely common. Emotional decision-making often leads traders to abandon their plans and take impulsive trades trying to recover losses quickly.
Finally, many traders constantly switch strategies after short losing streaks. Even profitable trading systems experience periods of drawdown, which is why consistency and discipline matter so much in technical analysis.
How Beginners Can Start Learning Technical Analysis
The best way to learn technical analysis is through observation, repetition, and experience. Beginners can start by studying charts daily, identifying trends, marking support and resistance levels, and reviewing historical price action.
Many traders also use demo accounts, market replay tools, paper trading platforms, and funded trader evaluations to gain practical experience before risking significant personal capital.
This is one reason funded trader programs have become increasingly popular among futures traders. Evaluations provide structure, rules, and clear risk parameters while allowing traders to practice consistency in real market conditions.
At OneUp Trader, traders can apply technical analysis directly within futures markets while developing discipline, execution skills, and risk management habits through the evaluation process. For many traders, the evaluation itself becomes part of the learning experience.
Technical Analysis and Funded Trading
Technical analysis plays a major role in funded trading because evaluations reward consistency rather than reckless risk-taking.
Funded traders often rely on technical analysis to identify repeatable setups, build structured trading plans, manage risk effectively, and avoid emotional decision-making. Whether traders use price action, trend trading, support and resistance, order flow, chart patterns, or moving averages, the goal remains the same: developing a repeatable edge.
At OneUp Trader, many successful futures traders use technical analysis as the foundation of their trading approach while working toward funded accounts and payouts.
The evaluation process encourages traders to focus on discipline, patience, risk management, and structured execution, all of which are critical components of long-term trading success.
Ending Off
Technical analysis is one of the most widely used methods for analyzing financial markets, especially among short-term traders and futures traders. While it may seem overwhelming initially, the core concepts are relatively straightforward once traders begin understanding how markets move.
By studying price action, trends, patterns, volume, and momentum, traders can begin building structured decision-making processes rather than relying on emotions or guesswork.
No trader masters technical analysis overnight. Like any skill, it takes practice, patience, and screen time to improve. However, traders who commit to learning market behavior, managing risk properly, and executing consistently often place themselves in a much stronger position over the long term.
For many futures traders, funded trader evaluations provide an opportunity to apply these skills in real market environments while working toward funded accounts and payouts.