

Introduction
S&P 500 futures have responded exactly how bulls would have hoped following the pullback we discussed in our June 9 analysis.
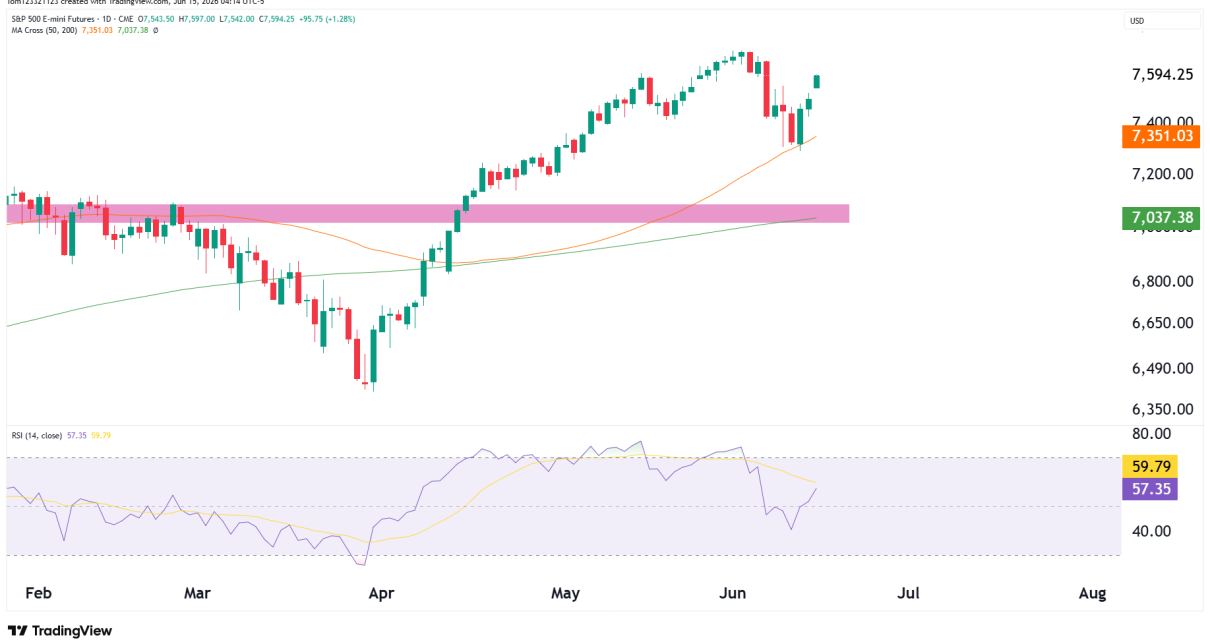
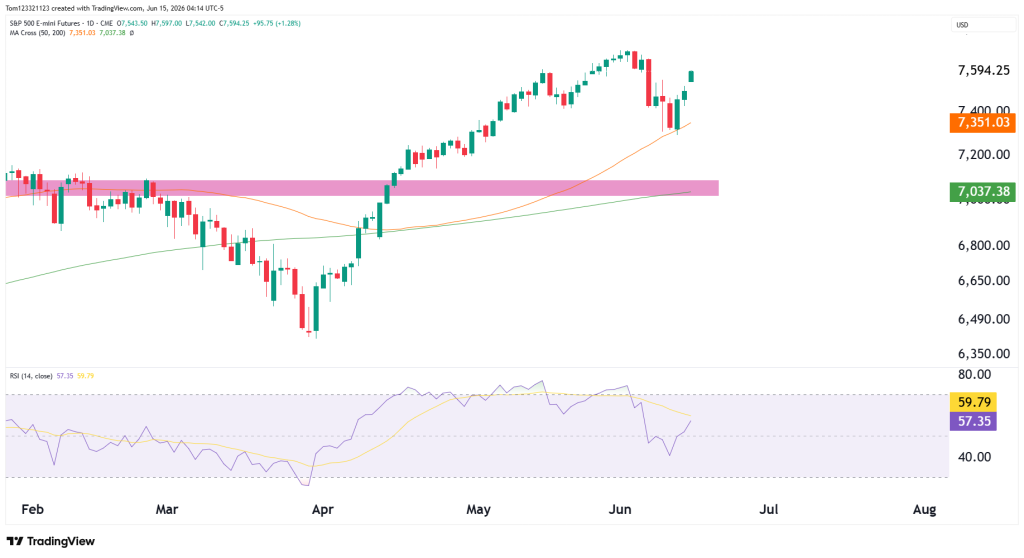
Last week, ES had just triggered its first Supertrend sell signal since February and was pulling back from the highs near 7,650. After selling off and testing the 50-day MA, buyers stepped back in and pushed the price, closing to test the highs again.
This is strong for the bulls because it shows that there is still a high amount of buying interest and that the market is really looking for anything to go long. Even when there is news of Donald Trump escalating attacks in Iran, the market does not react. What we can see is that on any bullish news, it is magnified 10x by the market, any bearish news is subdued by 10x, meaning that the market is looking for any excuse to buy.
With this in mind, let’s take a closer look at the technicals and what they are telling us.
ES Futures Trend Analysis
Important Points
The key aspect in today’s technical analysis for the S&P 500 is that the 50-day MA held very strongly. We saw a bounce immediately last week, Thursday, with a bullish engulfing candlestick pattern.
The next level to test is the ATH, which leaves room for a 100-point move to the upside.
Estimated Probabilities for S&P 500
| Scenario | Estimated Probability | Market Interpretation |
|---|---|---|
| Move toward 7,700 | 55% | Buyers regain full control and continue the uptrend |
| Consolidation between 7,400 and 7,650 | 30% | Market pauses before choosing direction |
| Pullback toward 7,200 support | 15% | Sellers defend highs and trigger another correction |
Key Support and Resistance Levels
Major Resistance Levels
- 7,650 recent high
- 7,700
- 7,800
Major Support Levels
- 7,351 (50-day moving average)
- 7,200
- 7,037 (200-day moving average)
- 7,000 breakout zone
ES Possible Trades
Bullish Continuation Trade
The primary trend remains bullish. If buyers can break above the recent highs and hold those levels, ES could continue its move higher toward the 7,700 region and potentially more.
Consolidation Trade Setup
The market has already recovered significantly from the recent pullback. Rather than immediately breaking higher, we could see a period of sideways movement near current levels while traders digest recent gains and wait for fresh catalysts.
Bearish Rejection Trade
While the broader trend remains positive, traders should continue monitoring the recent highs. If sellers successfully defend resistance and momentum begins fading again, another pullback toward the 50-day moving average could develop.

This analysis is provided for educational and informational purposes only and should not be considered financial or trading advice. Trading futures, forex, and other leveraged financial instruments carries a high level of risk and may not be suitable for all investors. Past performance is not indicative of future results. Before making any trading decisions, conduct your own research, assess your risk tolerance, and consult with a qualified financial advisor if necessary.

