

Technical analysis Zones Bull & Bear Cases Bull Case (higher probability) Bear Case (moderate risk) Trade Ideas Breakout Buy Opportunity (Momentum Continuation) Support Bounce Buy (Mean Reversion) Trades to Avoid Final Outlook Timeframe Outlook Bias Commentary Short-Term Consolidation Neutral-Bullish Price digestion after strong run-up Medium-Term Uptrend intact Bullish Higher lows, reclaim of MAs, poised for Read More…
Month: May 2025

Interest Futures Volatile Amid Tariff Worries, Inflation Concerns
US interest futures exhibit increased volatility as investors experience a complex confluence of factors influencing the Fed’s monetary policy trajectory. The recent return of Trump tariffs, ongoing inflation, and political factors have increased speculation about when and how much interest rates will change. The temporary reinstatement of Trump’s tariffs by a federal court has reignited Read More…
Crude Oil Futures Soar as Odds of Supply Hike Trimmed
Crude oil futures have risen this week due to tighter supply, geopolitical uncertainty, and improved global energy market sentiment. The WTI crude surged to near $63.00, marking a second consecutive session of gains. The bullish momentum came from OPEC+ maintaining production cuts, despite calls to boost supply for global economic recovery. A major catalyst for Read More…
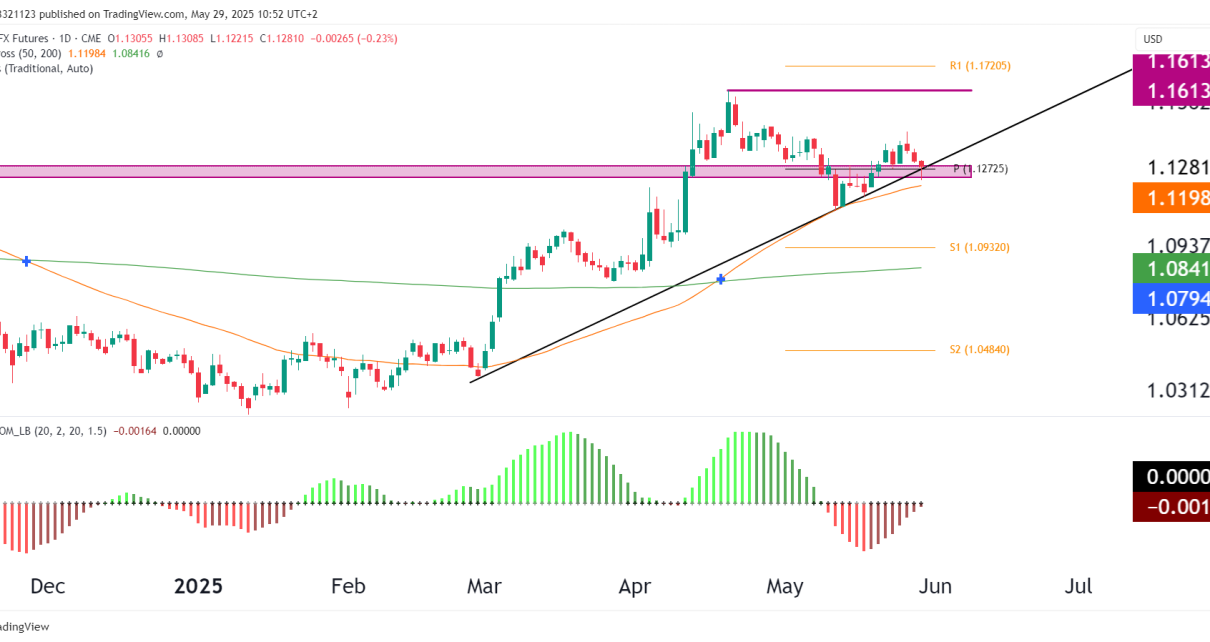
Technical Analysis Euro FX Futures (6E), May 29 2025
Price Structure & Technical Levels Momentum and Squeeze Probabilities Timeframe Bull Case Bear Case Probability Short-Term (1–2 weeks) Break above 1.1300 leads to quick test of 1.1450–1.1613 Failure at 1.1300 leads to pullback to 1.1198 and possibly 1.1120 Neutral-to-Slightly Bullish (55%) Medium-Term (2–6 weeks) Retest and hold of trendline, breakout toward 1.1720 Breakdown below 1.1180 Read More…
Dow Jones Futures (YM) Technical Analysis – May 27, 2025
Technical Analysis Structure and Trend Any clean break above the 200-day MA opens room toward the all-time high (~43,564). A bullish “golden cross” is not yet active, but a sustained breakout could tilt momentum in that direction. Probabilities Scenario Description Probability Targets Bullish Continuation Holds trendline and breaks above 200-MA High 42,557 → 43,564 (ATH Read More…

Gold Futures Bounce After Steep Losses, Eyes on FOMC Minutes
Gold futures (GC) remain caught between macroeconomic and geopolitical developments, reflecting an indecision in the market. The bounce seen on Wednesday looks more like a technical pullback than a shift in sentiment. Traders are cautious after Tuesday’s steep losses. The buying lacks noticeable conviction due to a confluence of mixed signals around the global landscape. Read More…
US Equities Jump as Trump Tariff Delays Lift Mood
The US equity futures surged on Tuesday. The move was attributed to improved risk sentiment due to President Trump’s delay to implement tequihe tariffs on Eurozone imports until July 09. The decision immediately alleviated trade tension and energized investors ahead of Wall Street’s opening after Memorial Day holiday. The S&P 500 futures gained 1.2%, Dow Read More…
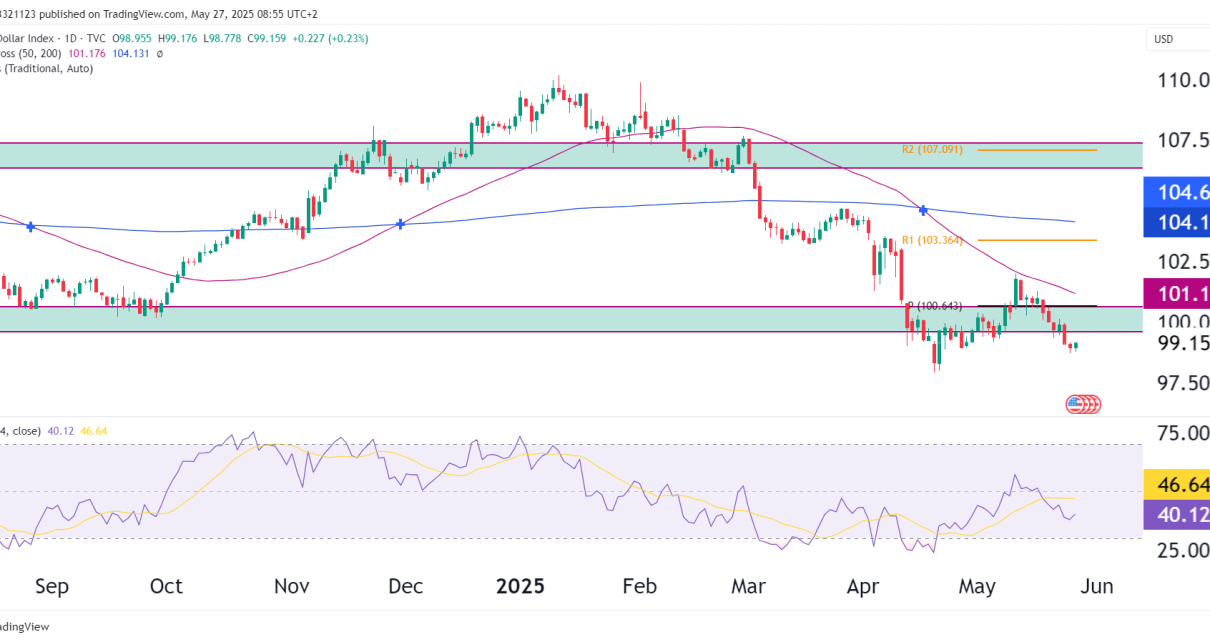
U.S. Dollar Index (DXY) – Technical Analysis May 27, 2025
Technical Analysis Breakdown Summary Bearish Signals Downside Targets if 98.50 breaks: Bullish Counterpoints Bias Probability Trigger/Confirmation Target/Range Bearish Continuation 65% Break and close below 98.50 97.50 → 96.90 zone Short-Term Bounce 35% Reclaim of 100.64 + RSI > 50 101.18 (50 MA), then 103.36 (R1) Key Levels to Watch Type Level Significance Resistance 100.64 Former Read More…
Currency Futures Rally as Dollar Slides on Delayed Tariffs on EU
Currency futures opened the week with strong footing amid the mounting fiscal pressure from the US and growing consensus on the Fed’s rate cuts this year. The US dollar fell broadly against major counterparts in the futures markets, led by declines in the DXY and gains in Euro, Pound, Aussie, CHF and JPY futures. Read More…
S&P 500 E-Mini Futures (ES) Technical Analysis – May 26 2025
Technical Analysis Bullish Developments Bullish Case (High Probability) Probability: 65% Bearish Case (Low Probability for Now) Probability: 35% Key Technical Levels Type Level Commentary Resistance 5,962.75 R1 pivot — breakout confirmation trigger ATH Target 6,170.00 Next major resistance Support 5,809.13 200-day MA – reclaimed Support 5,618.52 50-day MA Key Support 5,397.50 May swing low – Read More…