- Equities surged as the Fed held rates steady for 2nd consecutive meeting after 11 hikes this year. No cuts are expected soon.
- Bullish weekly trendline and candle pattern on ES provides stop loss placement and potential bottom. Signals have more upside.
- Daily overbought near term, so consolidation likely before new highs. Wait for pullback to enter longs unless long-term view.
Introduction
Equities surged last week as the Federal Reserve’s decision to hold interest rates steady in November marked the second consecutive meeting without a rate hike, following 11 hikes this year. Chair Powell stressed that while risks of undershooting or overshooting inflation targets have balanced out, no rate cuts are on the horizon. Markets don’t expect rates to drop until mid-2024. The Fed seeks to cool growth through an extended tightening period to control inflation, though forecasts predict slower expansion ahead.
This is a positive for equity markets as this is likely to spark new all-time highs in all indices as long as tension in the Middle East doesn’t heat up too quickly.
From here, we can already form a bullish bias on equity markets and use technicals now to buy pullbacks.
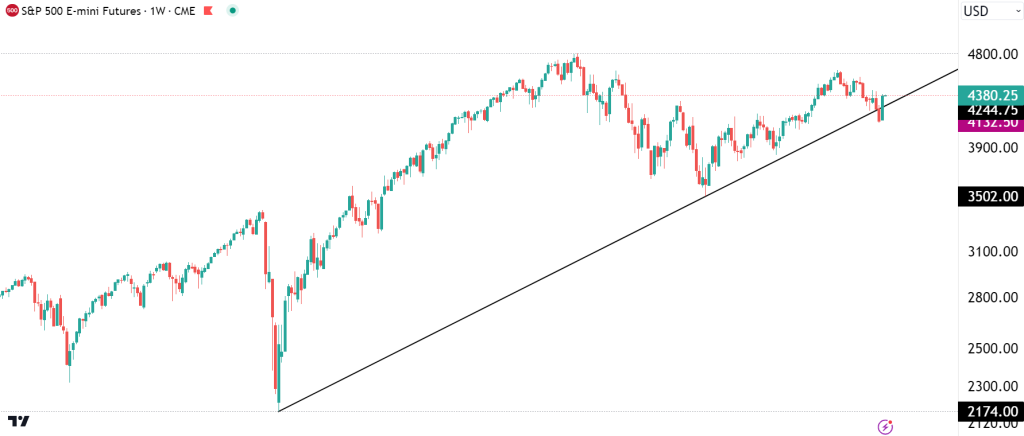
Weekly Chart
There is a solid bullish trend line on the weekly chart for ES. The price has just bounced off. It’s a strange coincidence that it would happen right at the time that the Fed would begin sending equity markets higher. Last week’s close formed a bullish engulfing pattern, which gives us perfect placement for a stop loss and likely bottom in the medium or even long term.
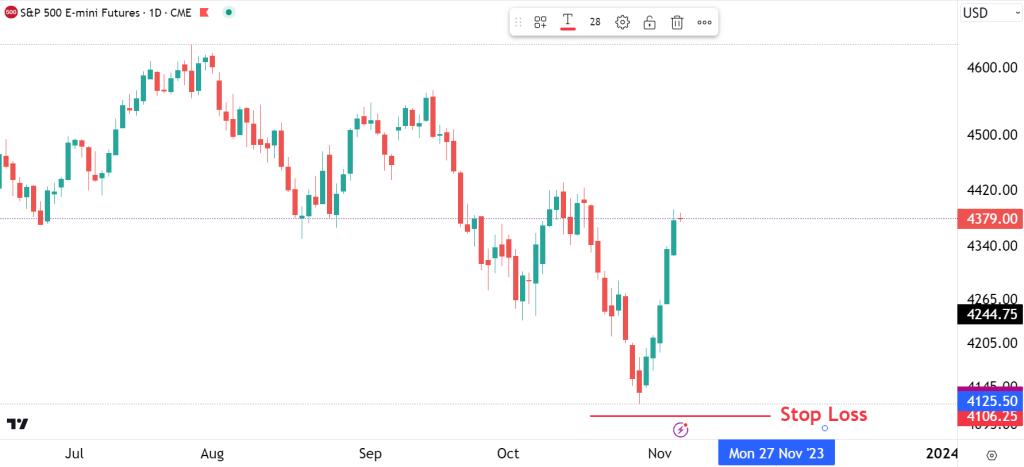
Daily Chart
The daily chart looks overbought in the near term. There might be a few red days or likely spinning top patterns that form now for the majority of this week before we wait to see if price starts approaching all-time highs. It might be the best option to wait that out before looking for longs unless your view is long-term and you are comfortable with the stop placement below last week’s low.