

Technical analysis patterns, including the double top and double bottom, provide savvy traders with a window into the psychology behind price movements. Skillfully leveraging these patterns could reap significant rewards. This guide will explore how to identify and utilize double tops and bottoms to improve your knowledge on chart patterns.
The basics of the double top pattern
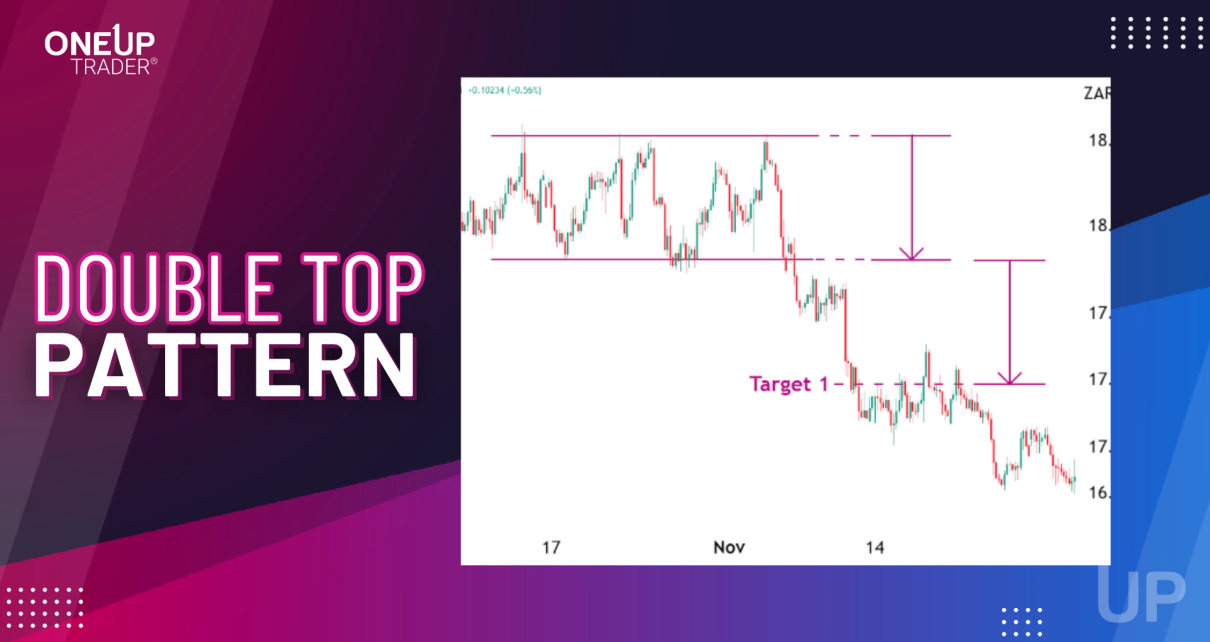
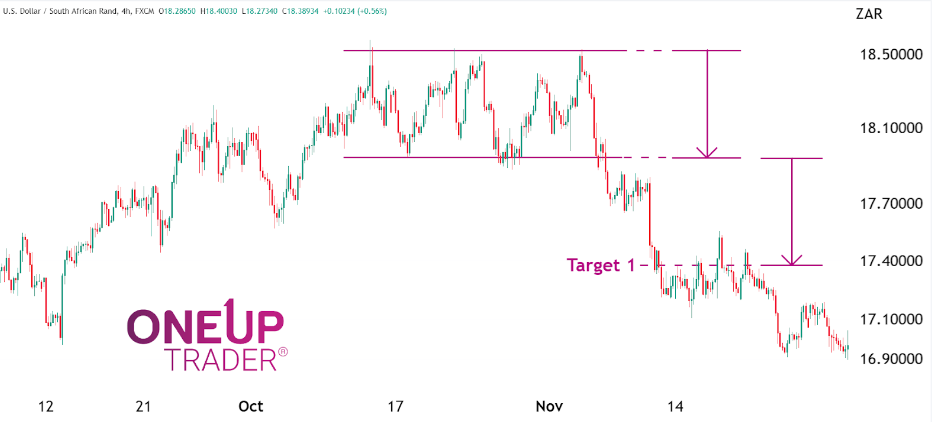
The double top pattern forms after an established uptrend, signaling waning bullish momentum. It comprises twin peaks at approximately the same price level, with a moderate trough between them. This “M” shape indicates the bulls failed twice to breach a specific resistance level. This formation means that the buying power has not been sufficient enough to continue with the uptrend, and thus, a reversal occurs where an influx of profit-taking and short-selling hits the market.
However, not all double tops mark a definitive trend reversal. Sometimes, the price would rally and successfully clear the resistance on the third attempt or fourth attempt. It is not unusual that after a double top forms, the market sits sideways for a while, then breaks out and continues with the uptrend. This is why it’s critical for traders to understand all the chart patterns that are involved in technical analysis.
Below is an example of a triple top, which functions the same way as a double top, with the only difference being that there are three peaks. Targets are set by measuring from the peaks to the valley and then extending it below the valley.
The double bottom pattern
In mirror image to the double top, the double bottom hints at a change in trend or, at least, an end to the downtrend. Separating by a moderate peak, two distinct lows of roughly equal depths characterize this “W” pattern.
It illustrates the bears’ inability to push the price below a critical level despite two attempts. This tells us that the selling pressure is waning, and the bulls could step in at any moment, pushing prices higher.
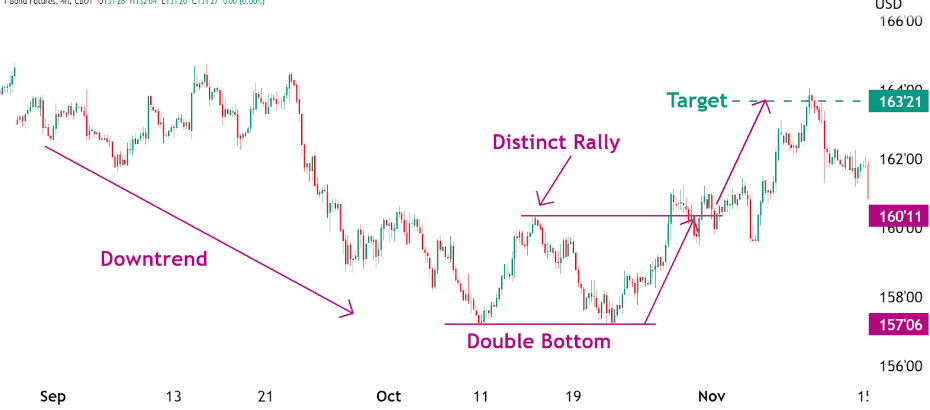
In the image below, we see a distinct downtrend followed by a double bottom that has a ‘relief rally’ followed by a bullish breakout. Notice how the distinct rally forms a level where we draw a resistance line, then price tests the low to form the double bottom, then rallies once more and tests the resistance line. Once we see a break of that resistance line, it’s a confirmation that the double bottom is in fact, a double bottom.
Characteristics of the double bottom
1. Preceding downtrend
The double bottom is a reversal formation. When looking for a valid double bottom, a trader should look for a steadily falling trend instead of a very sharp decline. The downtrend should be steady and last for some time. This will result in a more reliable double-bottom formation, and one trader can take advantage of.
2. Time between Bottoms
We must pay close attention to the “size” of the pattern – the duration of time between the two bottoms is also something we must monitor. The rally and distance between the bottoms must be present, and the troughs must be clear. Generally, the longer the time between the two bottoms, the more reliable the pattern is as a good reversal.
3. Decisive Breakout
When monitoring the double bottom for a breakout, we need to see price trade above the relief rally that is formed between the two troughs. Just like any breakout, we want to see a strong break with an increase in volume. If the price stalls for some time above the level it broke out from, it indicates that the momentum is just not strong enough to continue with the move. This has nothing to do with the pullback because pullbacks generally do happen and give us a second opportunity to enter. Make sure to monitor the initial break and look for signs of heightened volume and volatility to confirm the breakout is legitimate.
4. Pullback after Break out
Just like in the breakout of the double top, a pullback to test the neckline is common. Be sure to not get stopped out by dragging your stop to break even too quickly once the break does occur. We can also use the pullback as another point to take a long trade.
How to trade the double bottom and double top pattern
The double bottom can be traded a few ways, but what it gives us is a way of identifying the probabilities of where the market may end up going in the short term. If we use it to give us a direction and use another strategy to take our trades, that can work too. For example, let us assume we have a moving average pullback strategy on the 5-minute chart, and we have identified a double bottom forming on the hourly chart. We may see a short signal form on our 5-minute chart, but because of our technical analysis on the hourly, we see probabilities have been lowered for the short trade due to the double bottom formation, so we can ignore this signal.
Trading it by the book
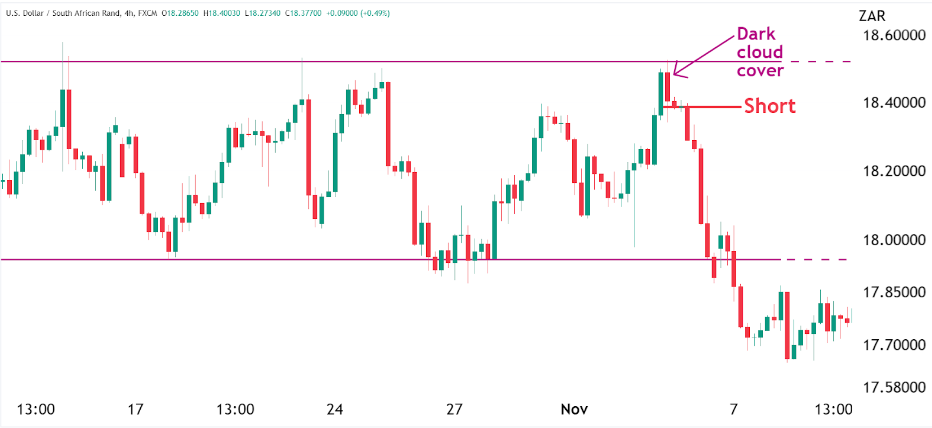
The double top pattern can be traded in two ‘by the book’ ways. The first is to simply wait for a break below the neckline and take a short there with a stop above the peak of the top. The second and more interesting way is to ‘front run’ the formation. This is riskier because there won’t be confirmation that the pattern has formed yet, but nonetheless, it provides a great risk-reward ratio. Once the first peak has formed, we wait to see if the market retraces to form the valley, then rally again to test the first peak. This is the critical point where the possibility of the double top could begin to form. Then, we focus on candlestick reversals to take the entry. In the chart below, there is a dark cloud cover pattern which formed at the same price level as the previous peak. A short trade can be opened with a stop above the high of the peak. This way of trading the double top pattern has a smaller probability of success but a much greater risk-reward ratio. The first target can be set to the neckline support, and if that breaks, confirming the pattern is legit, a second target can be placed by measuring the valley to the peak and extending it below the valley.
Conclusion: Trading Lessons from Tops and Bottoms
The double top and double bottom pattern is an easy-to-understand chart pattern that all technical analysts should study. Just like all chart patterns and trading setups, traders must follow strict risk management rules to reap the full benefit of them. Remember to keep accurate stop placement and never risk more than you can afford to lose on a trade. I hope this was insightful and you know a little but more about double tops and double bottoms.

