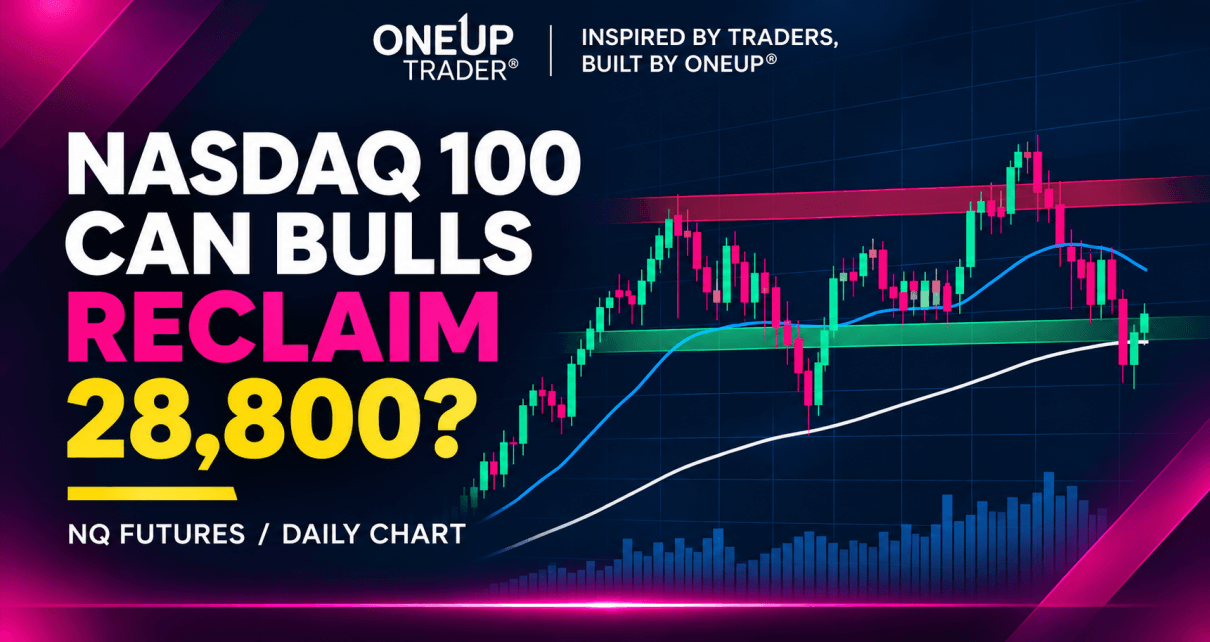



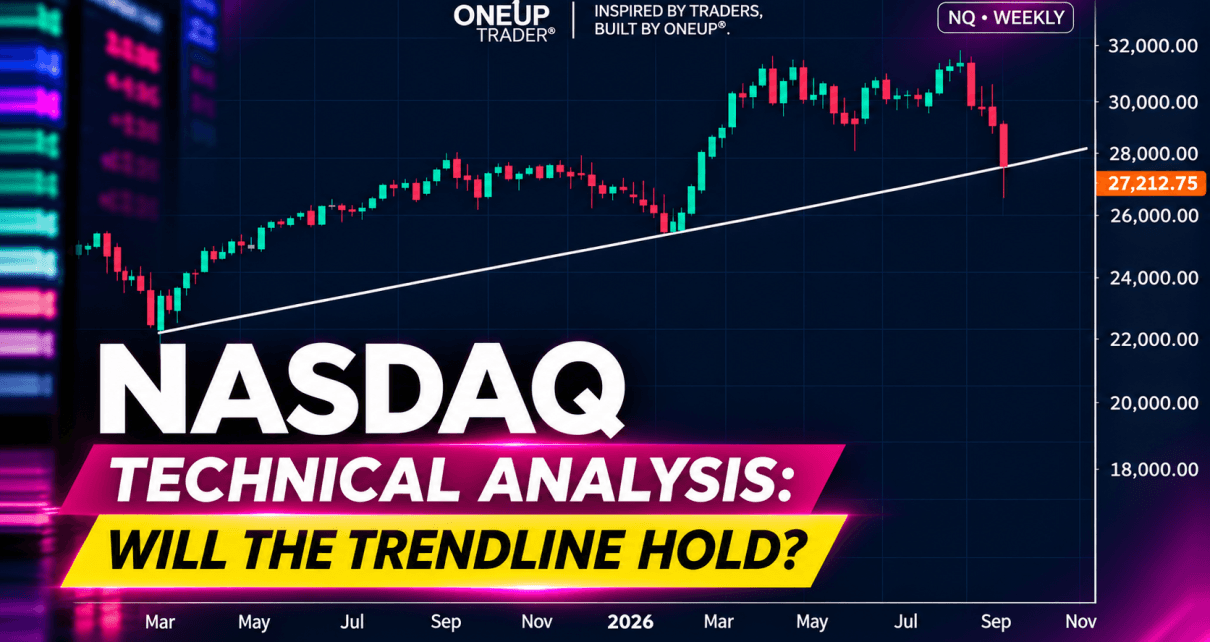
Introduction The recovery we looked at in our 4 November analysis did not hold. We were watching for bulls to reclaim 28,800, but sellers have since pushed NQ below the moving averages and the July low area near 27,200. Today’s session is showing another attempt to reverse, with price recovering from 26,366.50 to around 27,204, Read More…
Tag: Future Trading Tips
Interest Futures Gain as AI Worries Trigger Flight to Safety
Interest futures gained on Thursday amid a migration to safe-haven assets due to a selloff in the US tech sector. The move came amid AI worries and as market participants grew cautious ahead of the non-farm payrolls report. At the same time, the US midterm election outcome lowered the likelihood of an escalation in the Read More…
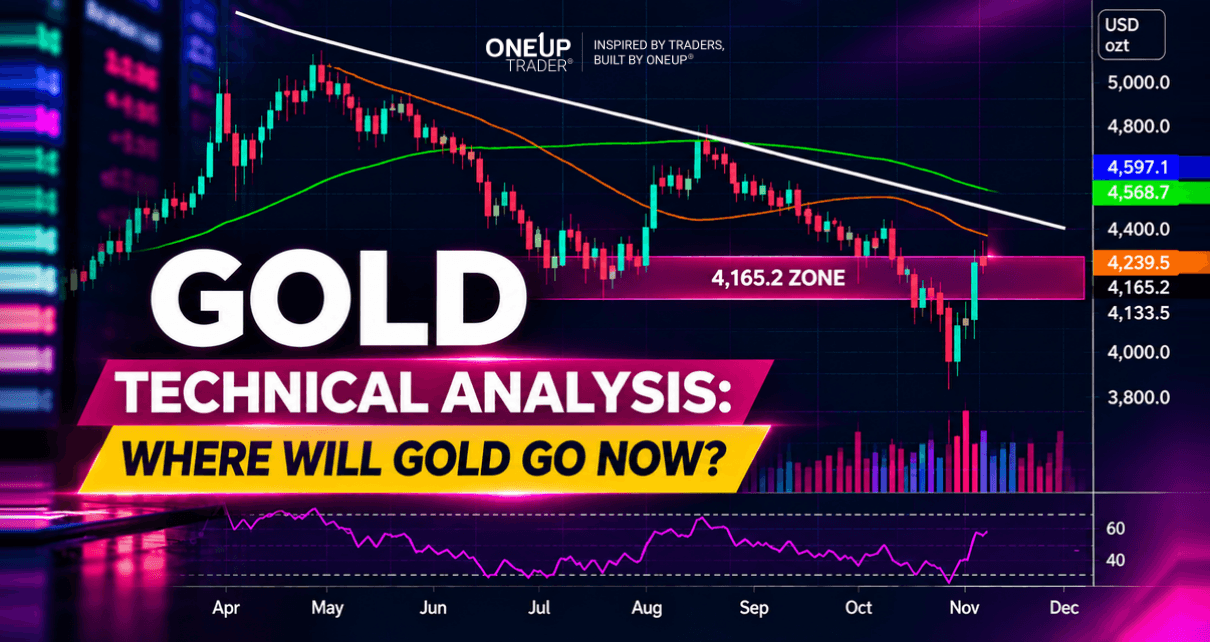
Gold Futures Technical Analysis: 5 November 2026
Introduction Bulls and bears have been slogging it out on GC futures with no side taking the upper hand as the yellow metal has been trading in a sideways range since June. Gold rallied really hard from the start of 2024, almost 145%, which is the fastest and strongest rally that we have seen since Read More…
Oil Plunges as Trump’s Midterm Loss Raises Hopes for Iran War Resolution
Oil prices collapsed on Wednesday after Trump lost the midterm elections, increasing the odds of ending the Iran war. JD Vance blamed the war for their loss. Moreover, experts believe Democrats will now pressure the president to end the expensive war. Elsewhere, market participants are looking forward to the US non-farm payrolls report. Brent futures Read More…
NASDAQ (NQ) Technical Analysis: 4 November 2026
Introduction Nasdaq dropped below the 200-day moving average yesterday (4 November) for the first time since March. The price action for today’s session is already showing strong signs of a bullish reversal. With no red-flag news events today, let’s take a closer look at the technicals and see if there are any possible trade opportunities. Read More…
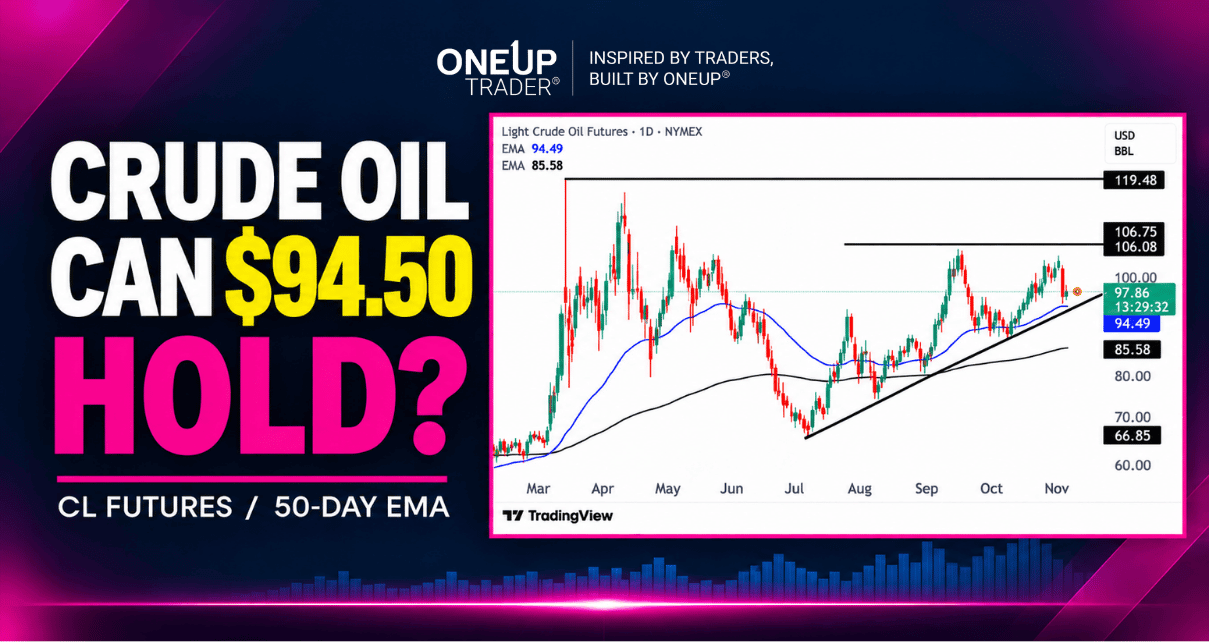
Crude Oil Technical Analysis: 3 November 2026
Introduction Last time we looked at Crude Oil was on the 22nd of October. The ascending triangle we looked at then is still the most prominent feature on the chart. CL rallied for two weeks after the analysis we did to test the resistance at 105.10, and the selling was strong enough to send price Read More…