

Introduction The U.S. Dollar Index (DXY) is currently testing a key support zone between 106-107, following a pullback. The dollar remains in a strong uptrend, trading well above the 100-week SMA (104.261). As of today 28/02/2025, DXY is trading at 107.775, up +0.69%, showing signs of stabilization after the recent pullback. If the 106-107 support Read More…
Month: February 2025

Interest Futures Fall as Trump Holds Firm on Canada-Mexico Tariff Timeline
Interest futures fell on Thursday as the dollar, and Treasury yields rose after Trump maintained the timing for tariffs on Canada and Mexico. However, prices rebounded on Friday as market participants focused on US data and the outlook for Fed rate cuts. After almost a month, market participants expected the US President to further delay Read More…
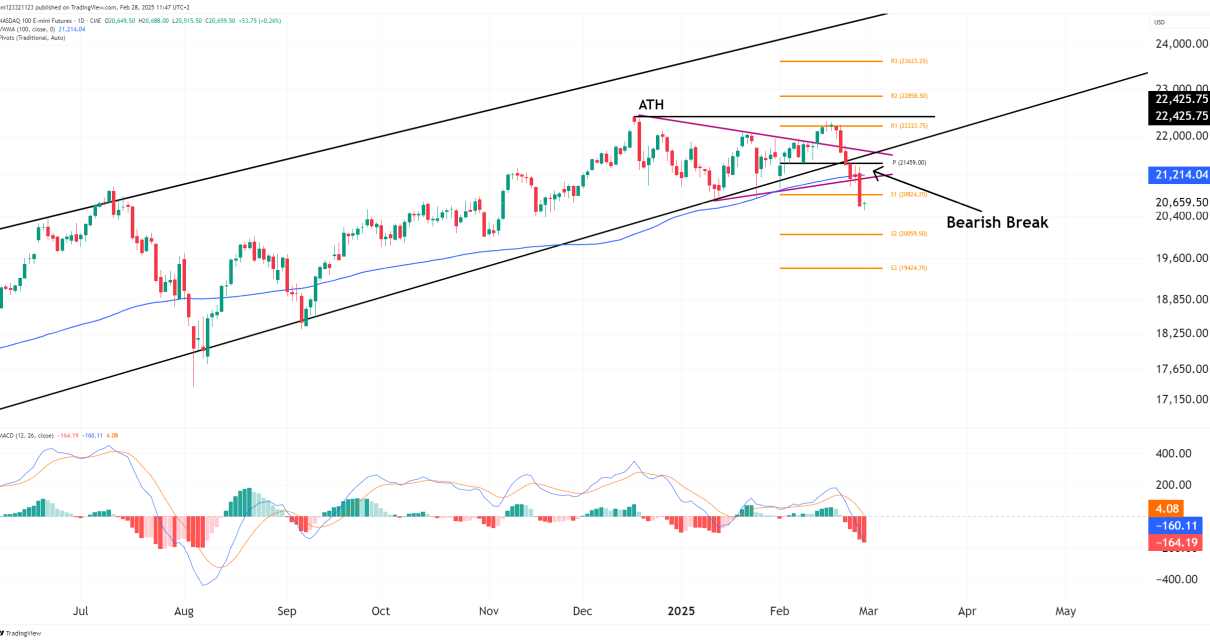
NASDAQ 100 (NQ) Break Lower—Trend Shift or Bear Trap?
Introduction NASDAQ 100 E-mini futures (NQ) have broken below their long-term ascending trendline, signaling a potential shift in market momentum. The index failed to reclaim its all-time high (ATH) at 22,425.75, leading to a breakdown that has taken price below key support levels. As of today, NQ is trading at 20,676.25, up +0.34%, attempting to Read More…
Gold Prices Retreat Amid Profit-Taking and Stronger USD
Gold prices fell as investors took profits from the recent peaks, and the dollar soared amid US tariff uncertainty. Meanwhile, market participants looked forward to the US core PCE price index report for more clues on US monetary policy. Gold has had a bearish week so far after reaching new peaks on Monday. The rally Read More…
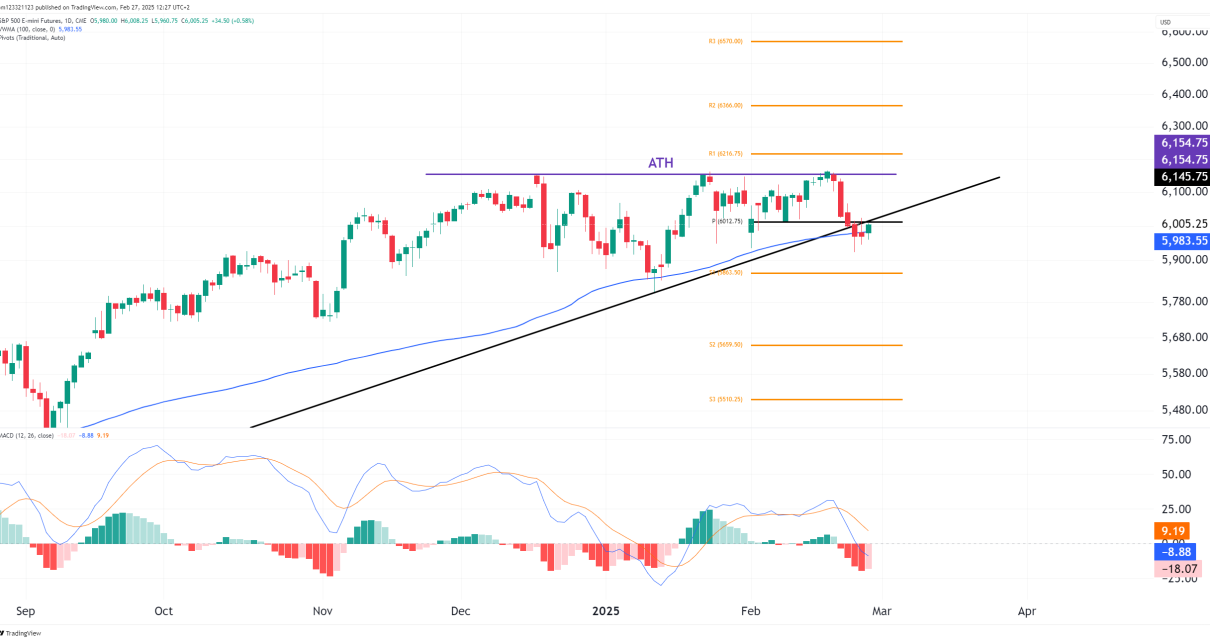
S&P 500 (ES) Break Trendline—Trend Reversal or Buying Opportunity?
Introduction S&P 500 E-mini futures (ES) have broken below their rising trendline support, signaling a potential shift in market structure. After failing to break the all-time high (ATH) at 6,154.75, price has pulled back sharply, testing key support zones. As of today, ES is trading at 6,004.75, up +0.57%, attempting to stabilize after a significant Read More…
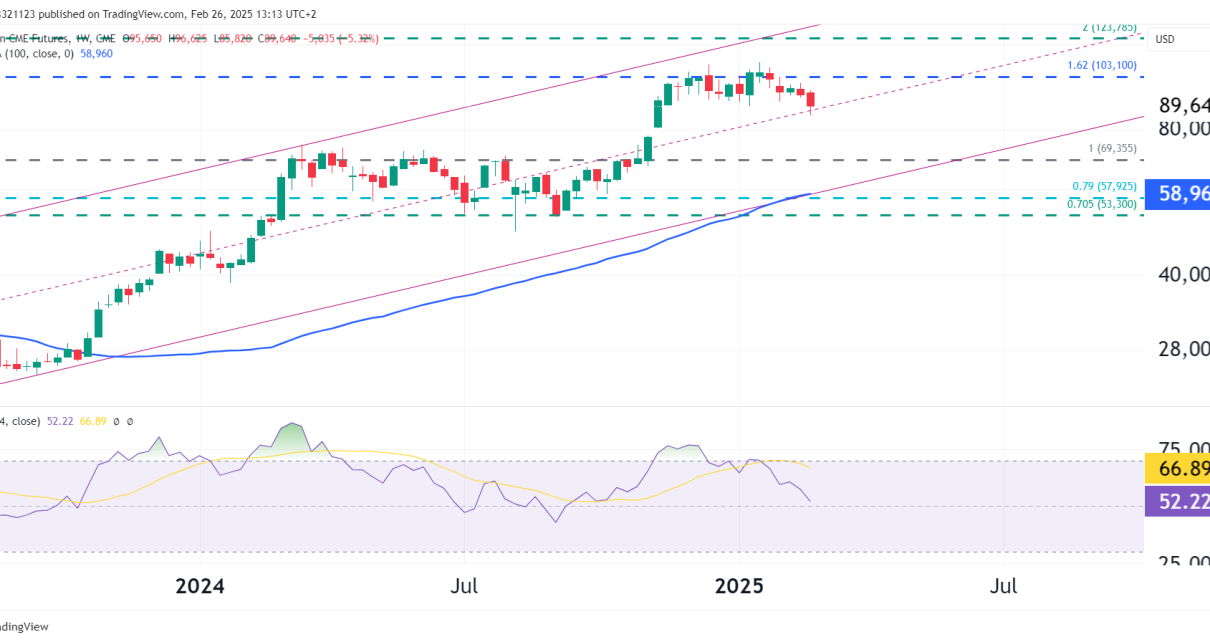
Bitcoin Futures Pull Back After Rally—Healthy Correction or Trend Shift?
Introduction Bitcoin CME futures (BTC1!) have pulled back after reaching recent highs, with price now testing mid-channel support. The broader trend remains bullish, but momentum is slowing as profit-taking and resistance near key Fibonacci levels weigh on price action. As of today, Bitcoin is trading at 89,640, down -5.32% on the week and 22% from Read More…
Oil Rebounds Mildly Amid Inventory Decline, Bearish Pressure Still Persists
The crude oil prices edged higher on Wednesday as the data from the American Petroleum Institute revealed a decline in the US oil inventories last week, helping the asset rise from 2-month lows. The Brent crude gained to $73.00 while WTI climbed to $69.00 at the time of writing. The API reported a decline of Read More…
Gold Futures (GC) Technical Analysis: Bulls in Control
Introduction Gold futures (GC) have been consolidating near all-time highs, with price action stalling after eight consecutive bullish weekly candles. The market showed momentum only last Tuesday, while the rest of the week saw sideways movement. Despite this consolidation, the weekly close remained bullish, keeping the long-term uptrend intact. As of now, gold is trading Read More…
Equities Struggle Amid Economic Uncertainty, Nvidia Earnings Anticipation
US equities closed mixed on Monday as investors digested geopolitical risks, economic uncertainties, and Nvidia’s upcoming earnings report. The S&P 500 dropped 0.53%, the NASDAQ fell 1.19%, while the DJIA stayed with a 0.08% gain. The equities lack directional bias following the last week’s decline with downbeat US retail sales and consumer confidence while inflation Read More…
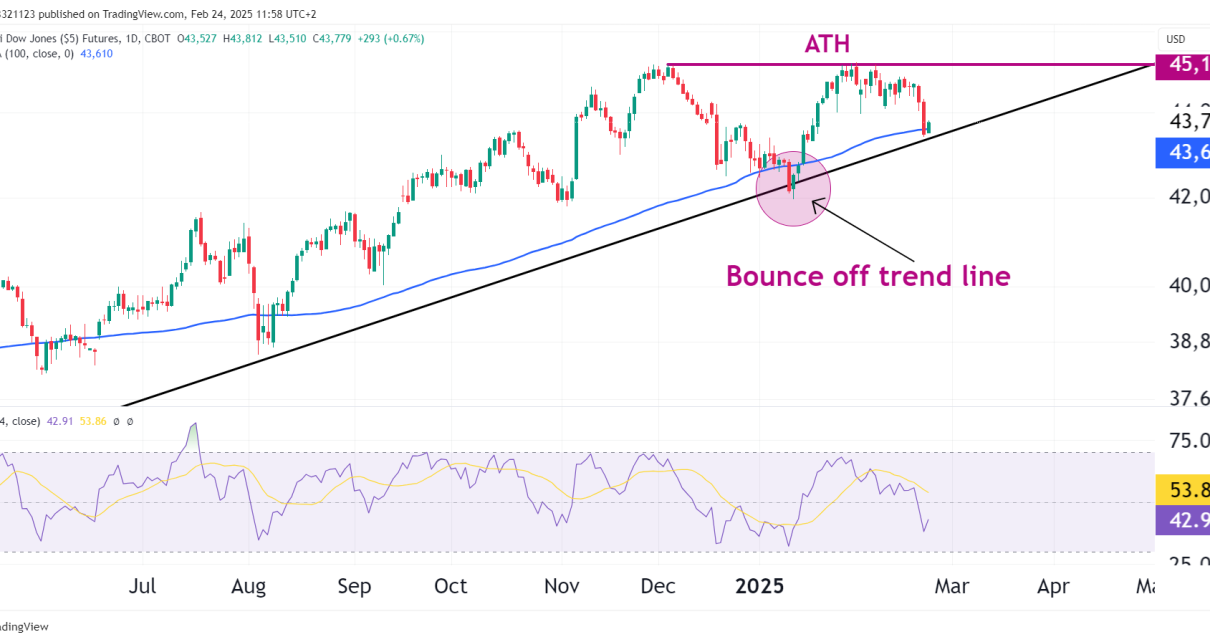
Dow Jones futures test bullish trendline
Introduction E-mini Dow Jones futures (YM) have rebounded off trendline support, regaining strength after a recent pullback. Price tested the ascending trendline and the 100-day VWMA (43,610), holding above these levels and keeping the long-term uptrend intact. Market Drivers & Key News Events Technical Analysis Bounce from Trendline—Higher Lows Intact Key Support & Resistance Levels Read More…