


Introduction
When we covered gold’s 7.6% run earlier this week, the driver was a collapse in September rate-hike expectations. The dollar is the other side of that trade, and it tells the same story from the opposite direction: DXY fell from roughly 101.70 in late July to 99.50 in early August, a drop of about 2% in a handful of sessions.
What makes the index interesting now is what has happened since. Three consecutive soft inflation and labor prints have landed — the July jobs miss on August 7, CPI on August 12, PPI on August 13 — and the dollar has barely moved, holding near 99.84 and roughly flat on the week.
The question is whether the softening rate story finally drags the index through that lower average, or whether the geopolitical bid keeps a floor under it.
Dollar Trend Analysis
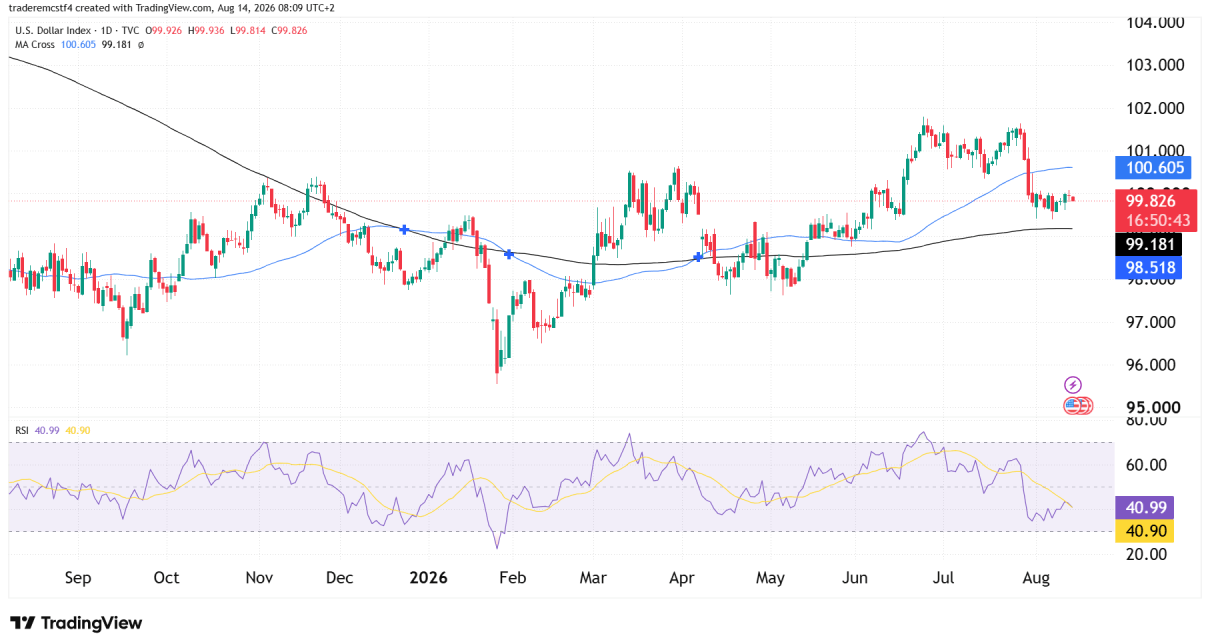
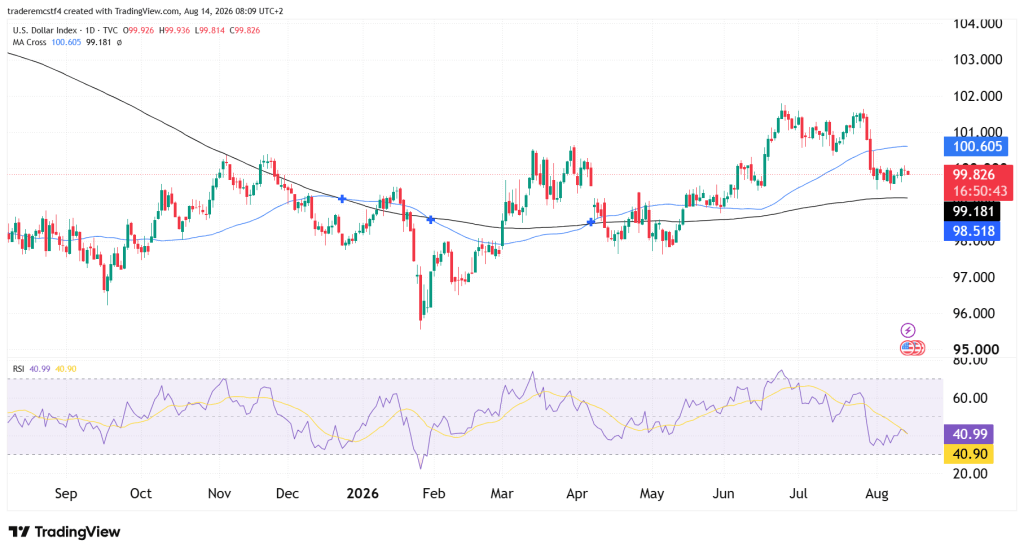
Price is compressed between the 50 and 200 moving averages. The faster average at 100.605 has rolled over and now sits above price, capping the August recovery attempts, while the slower average at 99.181 continues to rise gently underneath. That compression cannot last indefinitely. RSI at 41.19 has crossed marginally above its 40.91 signal line after bottoming near the mid-30s in early August, which is a recovery from oversold rather than a shift to strength — anything below 50 keeps the momentum picture tilted against the dollar. Zoomed out, the index has spent the past twelve months in a broad range between roughly 95.70 and 102.00, and the current level sits close to the middle of it.
The Data Week, in Context
Three prints in three days reshaped the rate outlook, and the dollar’s muted response is the notable part. A few points worth flagging:
- July CPI landed exactly on consensus. Headline inflation came in at 3.4% annually, down from 3.5% in June, with core at 2.5% — the lowest core reading since early in the year. September hike probability fell to 40.1% from 54.4% a week earlier.
- PPI was softer still. Final demand prices were flat on the month against 0.2% expected, with the annual rate slowing to 4.7% and core PPI rising 0.2%, also below forecast. Pipeline inflation is cooling.
- The dollar held anyway. Continued gridlock between the U.S. and Iran, and the stalled reopening of the Strait of Hormuz, have kept a safe-haven bid under the greenback, with oil back above $83 a barrel putting a floor under longer-run inflation expectations.
The bigger picture: rate expectations argue for a weaker dollar while geopolitics argues for a stronger one, and the chart is showing that disagreement as compression rather than direction. Retail sales are due Friday, and the FOMC minutes from the July 28-29 meeting — a 9-3 vote with three dissents in the same direction — publish August 19.
Remember, the Dollar is important to watch because of its influence on other US markets and Gold. If the Dollar is weakening, we generally see rising equity markets and Gold.
Key Support and Resistance Levels
Major Resistance
| Level | Notes |
|---|---|
| 100.00 | Round number the index has failed to hold since the August breakdown |
| 100.605 | Faster moving average, now declining overhead |
| 101.70 – 101.90 | July highs and the year’s peak area |
Major Support
| Level | Notes |
|---|---|
| 99.50 | August low, the floor since the jobs report |
| 99.181 | Slower moving average, still rising into price |
| 98.50 | Next structural support if the slower average gives way |
Summary
The dollar has absorbed three soft data prints in a row without breaking down further, which says as much about the geopolitical bid as it does about the rate outlook. Price is compressed between a declining 100.605 and a rising 99.181, and that range is narrowing session by session. A close below the slower average opens 98.50, while a reclaim of 100.605 would put the July highs back within reach.
Trading futures involves substantial risk of loss and is not suitable for all investors. Past performance is not indicative of future results. This analysis is for informational and educational purposes only and does not constitute financial advice. Always conduct your own due diligence and consult with a licensed financial advisor before making any trading decisions.

