
Currency futures were subdued on Monday as the dollar remained elevated after Friday’s rally. The greenback soared after the Fed Chair’s comments increased rate hike expectations.



Currency futures were subdued on Monday as the dollar remained elevated after Friday’s rally. The greenback soared after the Fed Chair’s comments increased rate hike expectations.
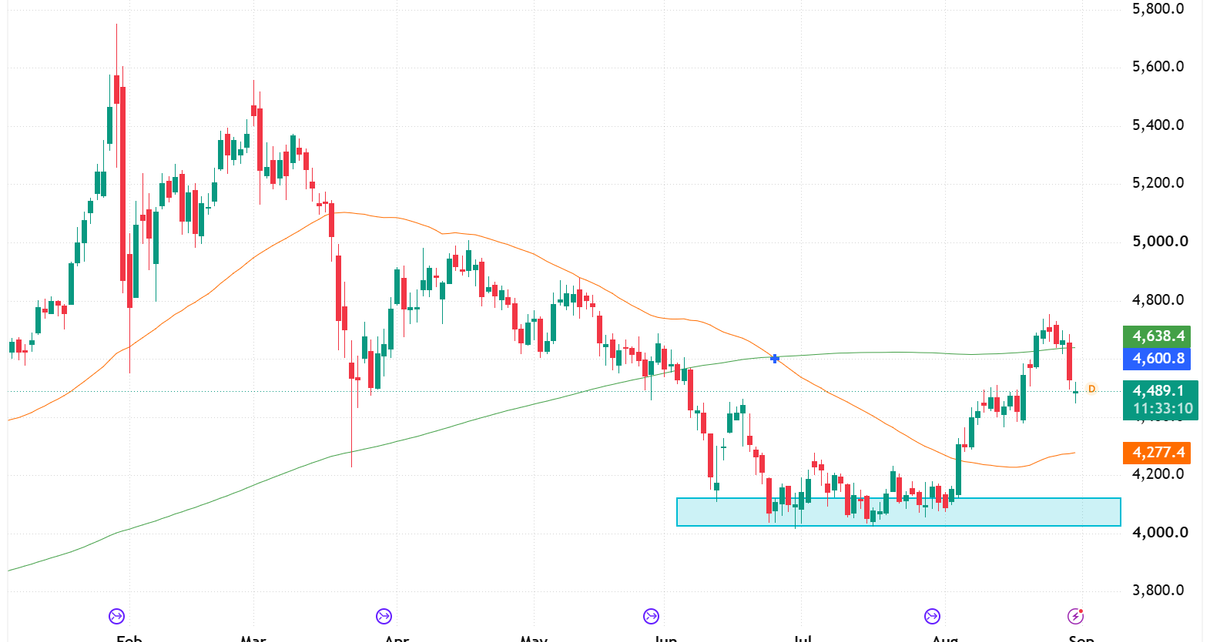
Introduction Gold has pulled back from a recent high near 4,650 after testing and breaking above the 200 day MA. What we are watching for now is whether this is just a pullback in a longer-term uptrend or if we move down to the 50-day MA and possibly even below $4,200. Gold Futures Trend Analysis Read More…
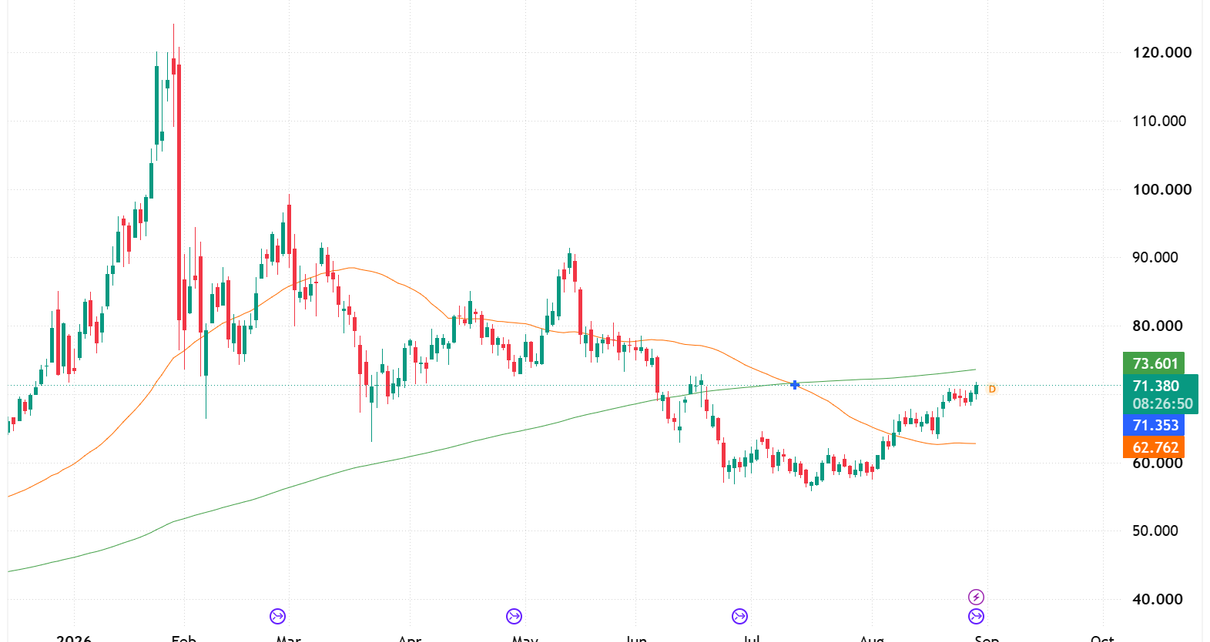
Introduction Silver has hit the first target from our 28 July analysis. The descending triangle broke upward, and price has run from the mid-57 area to 71.470, clearing the 71.24 objective we set at the time. That objective was the slow moving average, which has since risen to 73.601, and that is now the level Read More…

Interest futures were down on Friday as market participants looked forward to key speeches during the Jackson Hole symposium. Meanwhile, a surge in oil prices on Wednesday and Thursday supported Treasury yields, hurting bonds.
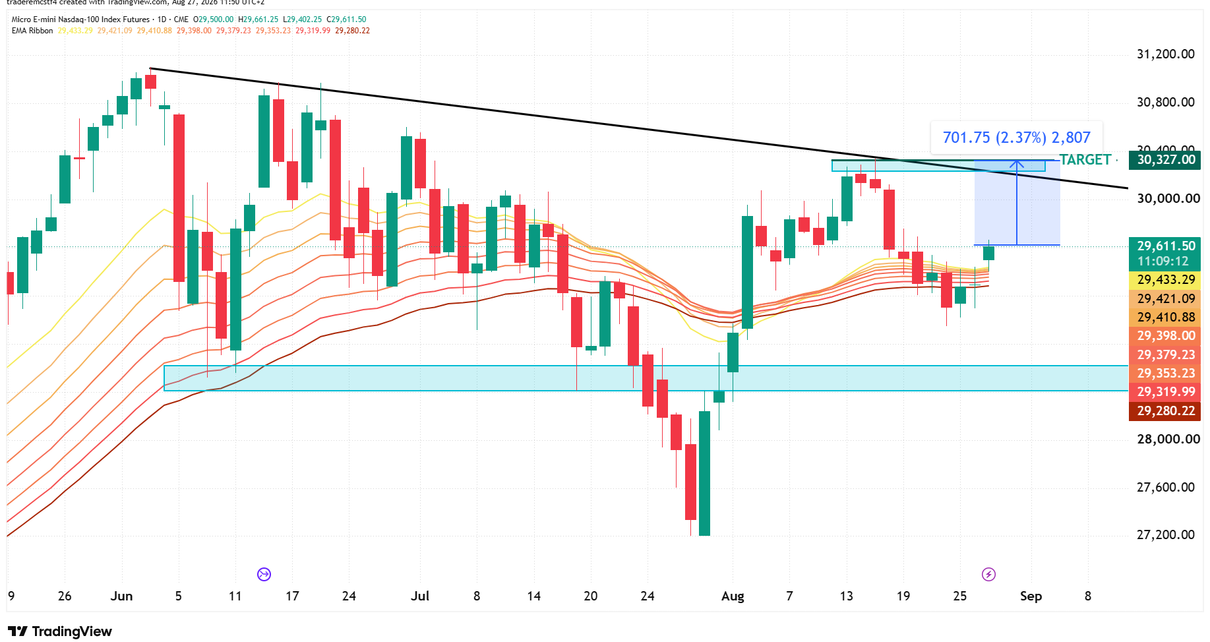
Introduction NQ has bounced off the EMA ribbon after a few days of sideways action. The ribbon spans 29,280.88 to 29,435.03 and has held through the pullback from the mid-August high. The measured target on this setup is 30,327, which is 701.75 points or 2.37% above current price, and sits where the descending trendline from Read More…

Oil prices fell on Thursday after Iran reached a deal with Oman to manage the Strait of Hormuz. At the same time, market participants were relieved when the US chose to use sanctions against Iran.

Gold paused its recent rally on Wednesday as market participants cautiously awaited the US core PCE price index report.
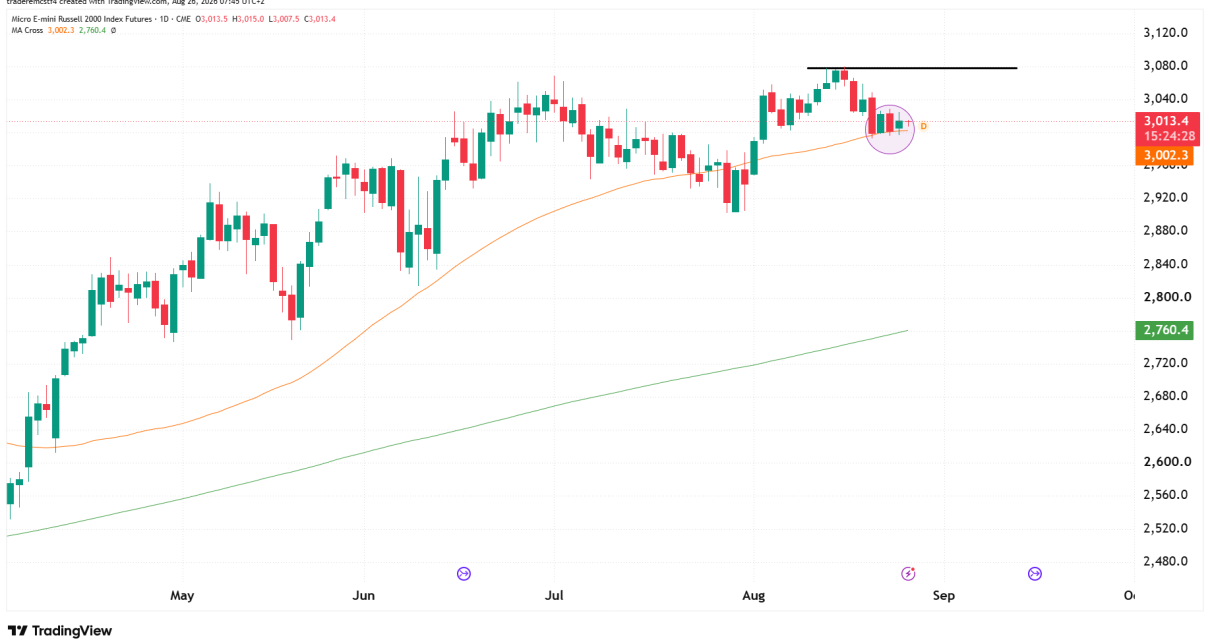
Introduction RTY has pulled back 2.15% from the 3,080 high and is now sitting on the rising 50 moving average at 3,002.3, which has tracked beneath this rally since April. The one time price traded below it was the early-August dip to 2,900, and that was recovered within days. The 200 moving average is far Read More…
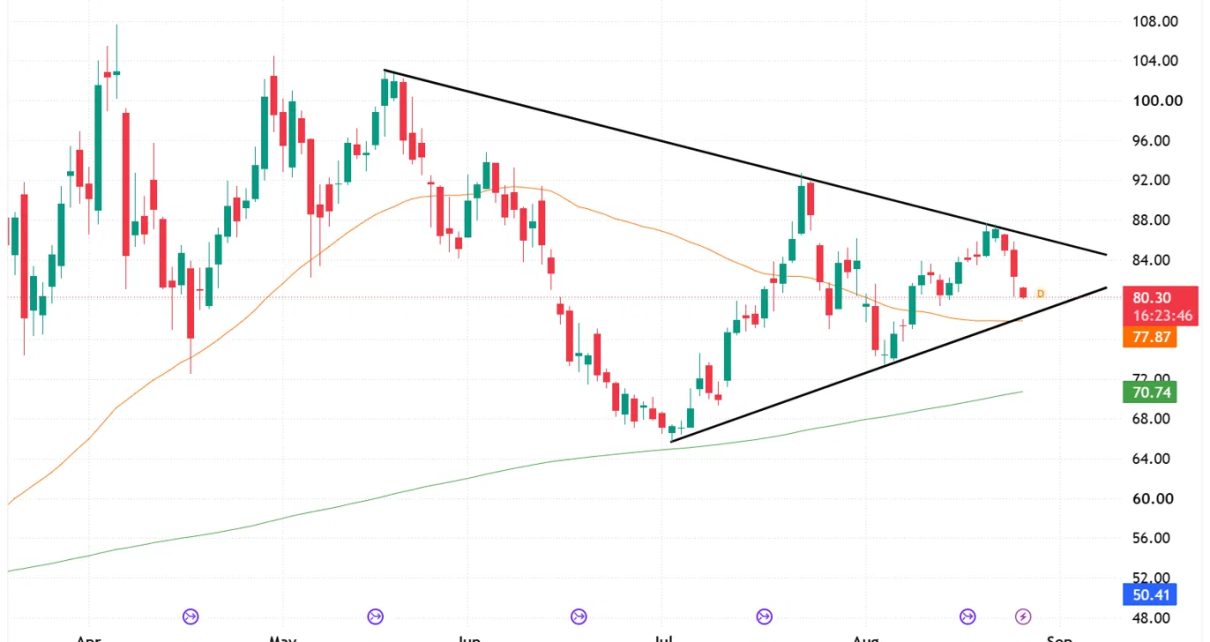
Introduction CL has dropped 8.7% in three sessions, from the 88 high on 21 August down to 80.30, and price is now getting close to testing the lower boundary of the symmetrical triangle that has contained it since late May. That boundary sits near 79, with the faster moving average at 77.87 just beneath it. Read More…
Equities were subdued on Tuesday as investors cautiously awaited Nvidia’s earnings report. At the same time, traders are looking forward to US inflation figures, which will shape the outlook for Fed rate hikes.