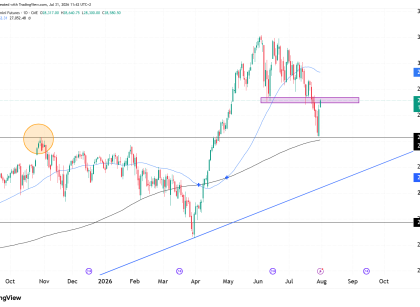
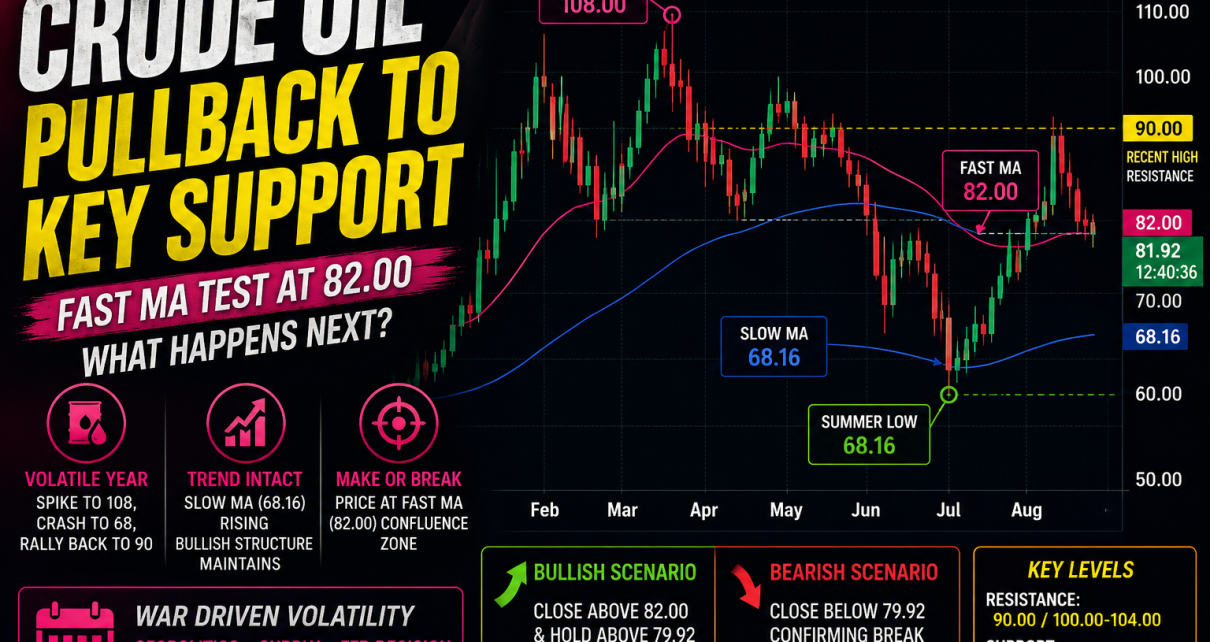
Introduction Crude Oil is now firmly in a downtrend, with the weekly chart printing 6 straight red weeks, and this week looks no different. CL has dropped 25% since September and is approaching a major support zone at $68 per barrel. Weekly Chart Price is now also below the point of control line, which is Read More…
Tag: futures trading
Equities Dip as Investors Brace for Employment Data Impact
On Monday, US equities declined, breaking last week’s rally, as investors became cautious before this week’s employment data. The data could impact expectations of an early interest rate cut by the Federal Reserve next year. S&P 500 nearly overbought (Source: Bloomberg) The S&P 500 achieved its highest close of the year on Friday after Fed Read More…
Nasdaq Futures (NQ) Pause At Resistance Level
Weekly Chart The weekly chart has seen 5 green weeks in a row, but this week has started off differently as NQ price rallied into a resistance zone at $15931, and price immediately began to sell off. Last week’s spinning top close is also a worry for the Bulls, but they will hope it is Read More…
Currency Futures Soar on Powell’s Cautionary Stance
On Friday, currency futures rose while the dollar declined after Federal Reserve Chair Jerome Powell expressed caution about further interest rate moves. Investors perceived Powell’s comments as dovish, anticipating that the Fed is done raising rates. Powell acknowledged that US monetary policy is slowing the economy, with the benchmark overnight interest rate in restrictive territory. Read More…
Gold Futures (GC) Blast Through All-Time Highs
Introduction Last week, Gold was trending because of how close it was getting to breaking all-time highs. We finally saw that happen, and it was explosive. GC futures burst out of the all-time high, with the price surging 3.15% in 30 minutes. Let’s see what the technicals are telling us now and how we can Read More…
T-Bond Futures (ZB) Technical Update
Introduction The T-Bond Futures (ZB) market exhibits a notable consolidation forming on the daily chart, with current price action gravitating towards the 50 and 100 moving averages, signaling potential shifts in market sentiment for the time being. Daily Chart Analysis It is clear that ZB has been a short sellers dream for the past few Read More…