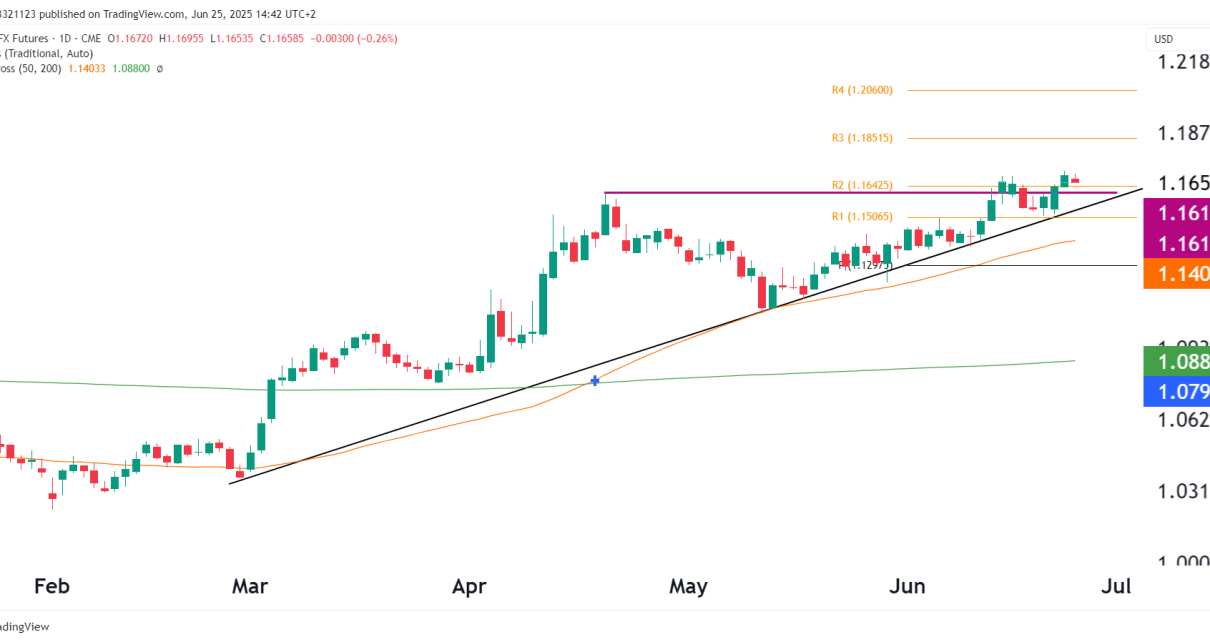
Russell 2000 RTY On April 28th, there was a long trade opportunity with an entry price of $1,747.6, a profit target of $1,826.3, and a stop loss of $1,693.7. The market has rallied since then, just missing our target by a few ticks, and has now dropped back to the original entry price. Before we look Read More…
Technical Analysis
Dow Jones futures (YM) rolls over as sentiment favors tech
Technical analysis YM has rolled over since the most recent local top made at $34,373 from the beginning of May. We have seen a dip of 5% which is not significant, but the price action tells us the bearish momentum may still have further to go. The 200-day moving average is being tested at the Read More…
Profitable trade update on Crude Oil futures (CL)
The trade Before we get into the new price action and the profitable trade regarding CL, take a look at the previous article to see how we entered the trade in the first place. The long has been successful so far, and it shows just how powerful it can be if we understand candlestick patterns objectively. The Read More…
Nasdaq (NQ) futures rally into overbought territory
Is the bull market back? NQ dropped over 37% from its peak back in November of 2021 to its low made in October of 2022. This, by definition, is enough to confirm a bear market. In order for us to confirm the new bull market, we need to see prices rally and remain above 20% Read More…
A fresh look at the Euro FX futures (6E)
Weekly Chart I applied the volume profile indicator to the weekly chart starting from the lows made in 2015. The point of control is resting at 1.13, which tells us that the most volume traded was at that price. If we see the Euro rally from here, we will set that as our first bullish Read More…
T-Bond Futures (ZB) price action update as short trade pays off
Trade update from previous analysis On May 2nd, we looked at a potential short trade in ZB. It has played out nicely, with the target very close to being hit. Take a look at the article here. There is an ascending triangle forming on the daily chart that we can monitor as price moves toward the Read More…