

Introduction
The triangle chart pattern is a popular technical analysis formation used by traders to identify potential trading opportunities. This pattern is formed by converging trendlines, creating a triangular shape on the price chart. There are different types of triangle patterns, including:
- Triangle pattern
- Ascending triangle chart pattern
- Descending triangle chart pattern
- Symmetrical triangle chart pattern
- Expanding triangle chart pattern
- Triangle wedge pattern
- Bullish triangle pattern
- Triangle trading pattern
This guide will provide an overview of the different triangle chart pattern trading strategies. We will explain how to identify the pattern, its characteristics, and how traders can use it to make trading decisions. The goal is to offer a straightforward guide on trading with triangle chart patterns so you can implement it into your trading plan.
Ascending Triangle Pattern
The ascending triangle pattern typically develops during an uptrend, indicating a potential continuation of the bullish momentum. It represents a period of consolidation, where the price is squeezed between the two converging trendlines. As the price repeatedly tests the resistance level and finds support along the ascending trendline, the buying pressure gradually builds up.
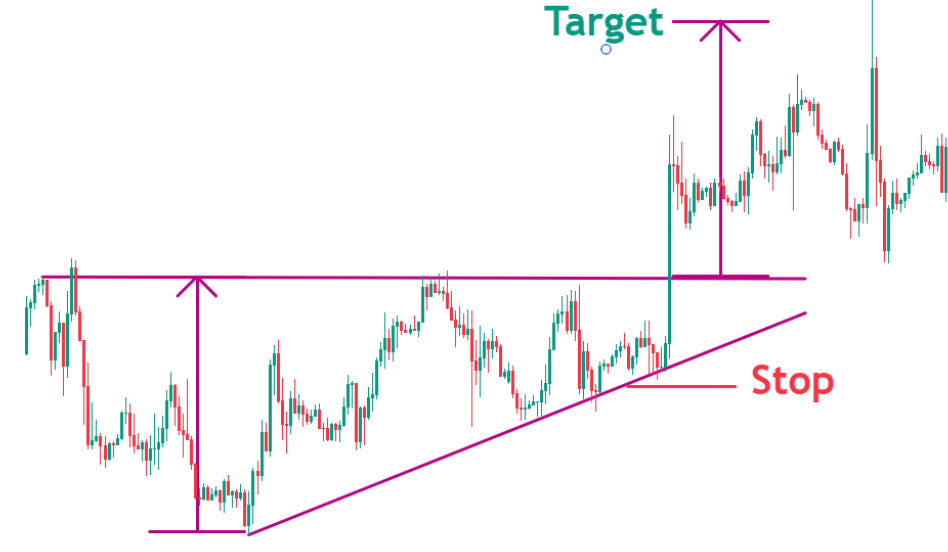
Key characteristics of the ascending triangle pattern:
- Horizontal resistance level (upper trendline)
- Ascending support trendline (connecting higher lows)
- Formed during an uptrend
- Indicates potential bullish breakout
Breakout Strategy: This is one of the most popular strategies for trading the ascending triangle.
How to trade the breakout strategy:
First, identify the ascending triangle pattern on the price chart. This pattern is formed by a horizontal resistance level acting as the ceiling and an ascending trendline connecting the higher lows, creating a triangular shape.
Next, monitor the price action as it approaches the horizontal resistance level. Wait for a clear and convincing breakout above this resistance level, ideally accompanied by an increase in trading volume. This breakout signals a potential continuation of the uptrend.
Once the breakout is confirmed, you can open a long position at the current market price or slightly above the resistance level, depending on your trading strategy and risk tolerance.
To manage your risk, place a stop-loss order below a recent swing low or the ascending trendline. The swing low represents a level of support, and a breach below it could invalidate the bullish breakout scenario. Alternatively, you can place your stop-loss order below the ascending trendline, as a break below this trendline could signify a potential trend reversal.
Determine your profit target based on your trading strategy and risk management rules. Some traders use technical analysis tools like Fibonacci extensions or previous resistance levels to set their profit targets. Another popular technique is to measure the distance from the ascending trend line to the horizontal resistance and then extend it above at the point of the breakout.
Determine the appropriate position size based on your risk management rules and account size. It’s crucial to practice proper risk management and never risk more than you’re willing to lose on a single trade.
Pull-back Strategy: Some traders prefer to wait for a pull-back after the initial breakout before entering a long position.
To trade the pullback strategy for an ascending triangle pattern, follow these steps:
Identify the ascending triangle pattern on the price chart, formed by a horizontal resistance level acting as the ceiling and an ascending trendline connecting the higher lows. Wait for a clear breakout above the horizontal resistance level, ideally accompanied by an increase in trading volume. This initial breakout signals a potential continuation of the uptrend.
Instead of entering immediately after the breakout, the pullback strategy involves waiting for the price to retrace or pull back temporarily after the initial breakout. This allows you to potentially buy at a more favorable price level.
Monitor the price action closely after the breakout. Look for the price to retrace and find support at the former horizontal resistance level, which now acts as a support level, or the ascending trendline.
Once the price finds support at either the former resistance level or the ascending trendline, and shows signs of reversing direction, you can initiate a long position (buy order) at the current market price or slightly above the support level.
Size your position according to your risk management rules, ensuring you don’t risk more than you’re willing to lose on a single trade.
After entering the trade, monitor the price action closely and be prepared to adjust your stop-loss or take profits based on the price movements and your trading plan.
By waiting for the pullback, you could enter at a better price level, but you also risk missing the initial move if the price continues to rally without a significant retracement.
Trend-following Strategy: Some traders may choose to enter long positions within the ascending triangle pattern itself, as the price bounces off the ascending trendline. This approach aims to capture the potential continuation of the uptrend, even before the breakout occurs. However, it carries a higher risk as the pattern may fail to break out.
Here are the steps to trade the trend-following strategy:
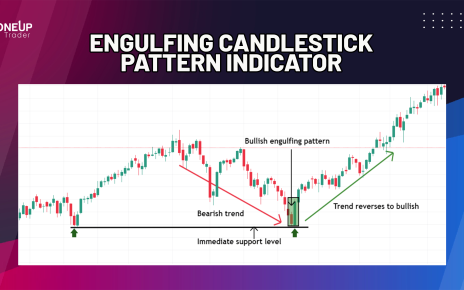
First, identify the triangle pattern on the price chart. As the price approaches the ascending trendline within the pattern, look for bullish signals or candlestick patterns that suggest the price may bounce off the trendline. These could include hammers, bullish engulfing patterns, or other reversal candlestick formations.
Once you identify a potential bullish reversal signal at the ascending trendline, initiate a long position at the current market price or slightly above the trendline level. Place a stop-loss order below the most recent swing low or below the ascending trendline, depending on your risk tolerance. This stop-loss level will help manage your risk if the price breaks below the trendline, potentially invalidating the pattern.
Descending Triangle Chart Pattern
In contrast to the bullish ascending triangle, the descending triangle chart pattern is considered a bearish formation that often signals the potential for a downward price movement. This pattern is identified by a descending resistance trendline acting as the upper boundary and a horizontal support level forming the lower trendline.
The trading strategies mentioned above are exactly the same for the descending triangle just in reverse.
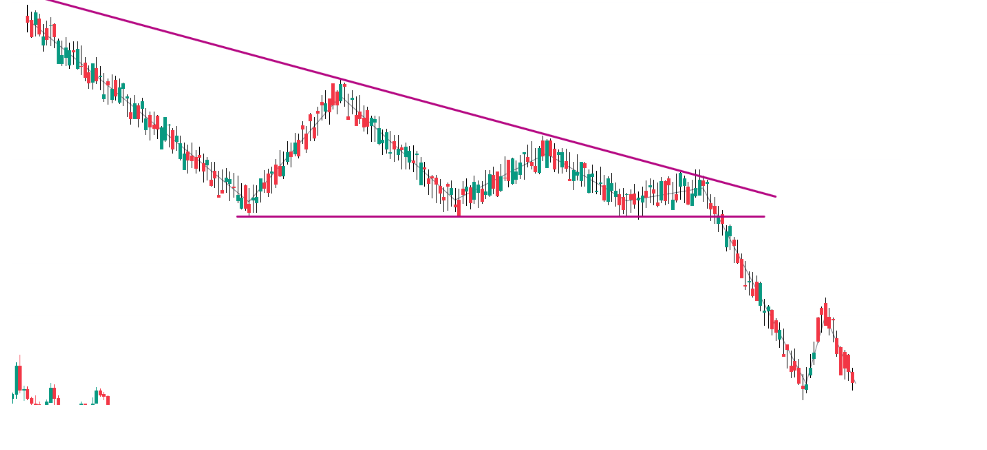
The descending triangle typically emerges during a downtrend, representing a period of consolidation where the price is squeezed between the converging trendlines. As the price repeatedly tests the descending resistance level and finds support along the horizontal trendline, selling pressure gradually builds up.
Key characteristics of the descending triangle pattern:
- Descending resistance level (upper trendline)
- Horizontal support level (lower trendline)
- Formed during a downtrend
- Indicates potential bearish breakout
Traders often look for a breakout below the horizontal support level, accompanied by an increase in trading volume, as a signal to initiate short positions. The breakout point is considered a crucial level, as it typically triggers stop-loss orders from long traders and prompts new sellers to enter the market, fueling further downward momentum.
When trading the descending triangle pattern, it’s essential to wait for a confirmed breakout below the support level before entering a short position. Setting appropriate stop-loss levels and profit targets is also crucial to manage risk and secure potential gains effectively.
It’s worth noting that while the descending triangle pattern is generally considered bearish, it can also act as a continuation pattern in some cases, especially during a strong downtrend. Traders should always consider the broader market context and other technical indicators to validate the pattern’s reliability and potential outcome.
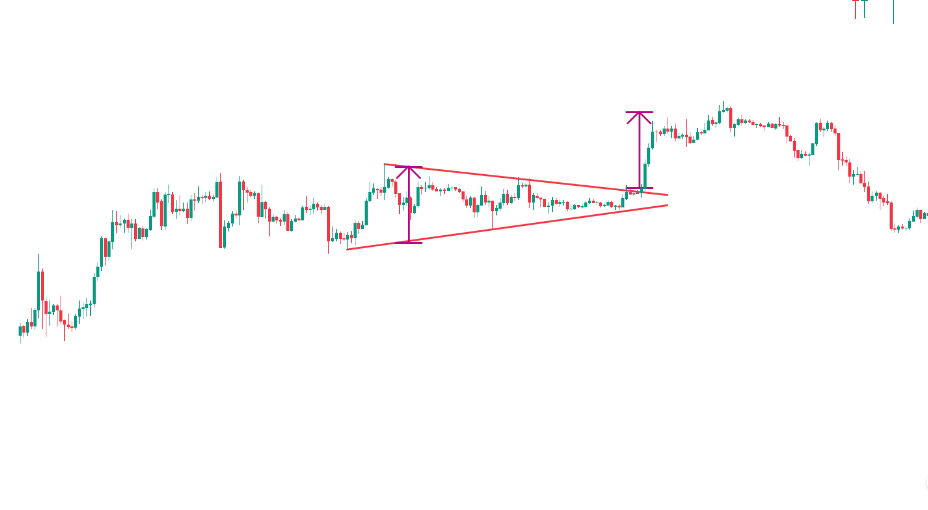
Symmetrical Triangle Chart Pattern
The symmetrical triangle chart pattern is a chart formation that combines both the ascending and descending triangles. Unlike its counterparts, this pattern is considered a neutral chart pattern, as it does not inherently favor a bullish or bearish bias. Instead, it represents a period of consolidation, where the price is squeezed between two converging trendlines, creating a triangular shape.
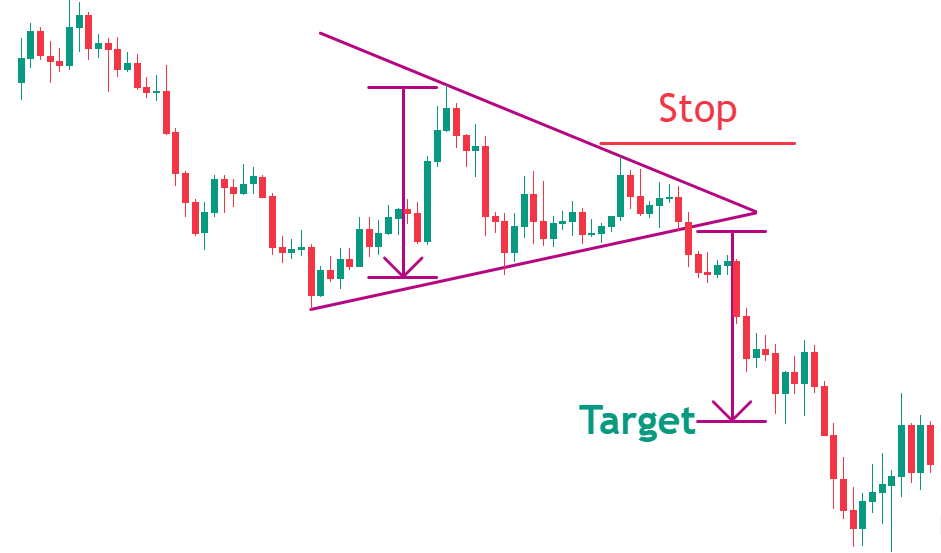
Key characteristics of the symmetrical triangle pattern:
- Two converging trendlines (one descending, one ascending)
- Formed during a period of consolidation
- Indicates potential breakout (bullish or bearish)
- No inherent directional bias
The symmetrical triangle pattern is often seen as a continuation pattern, meaning that the eventual breakout is expected to occur in the direction of the preceding trend. However, the pattern can also lead to a reversal, especially if the preceding trend was weak or the breakout occurs in the opposite direction.
When trading the symmetrical triangle chart pattern, traders can employ various strategies to capitalize on the potential breakout. Here are some common approaches:
The Breakout:
First, identify the triangle pattern on the price chart.
Next, monitor the price action as it approaches one of the levels. Wait for a clear and convincing breakout above the level, ideally accompanied by an increase in trading volume. This breakout signals a potential continuation of the trend.
Open the position and target the measurement of the triangle pattern as a minimum target. To manage your risk, place a stop-loss order below a recent swing low or the triangle itself.
Expanding Triangle Chart Pattern
Unlike the other triangle chart patterns we’ve discussed, the expanding triangle pattern is a relatively rare formation that can be more challenging to trade. This pattern is characterized by two diverging trendlines, creating an expanding triangular shape on the price chart.
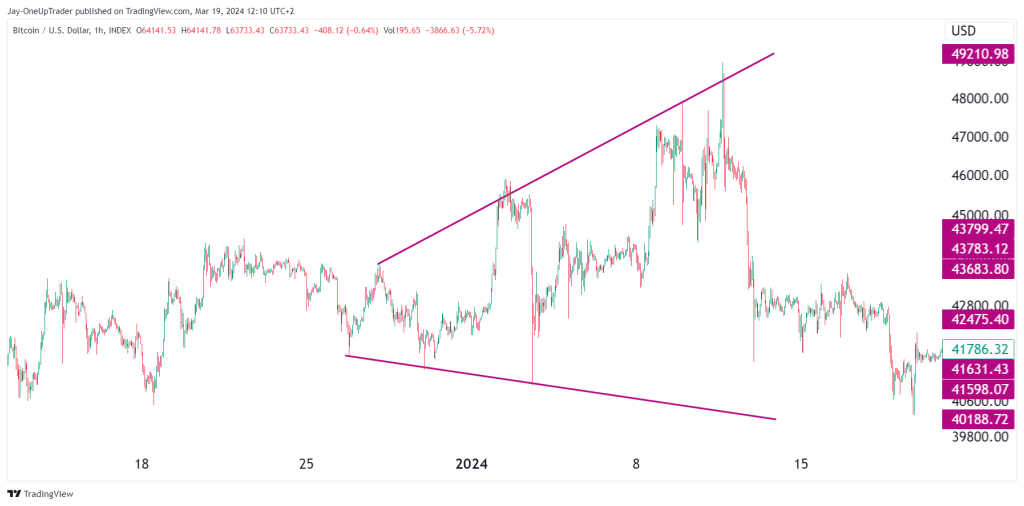
Key characteristics of the expanding triangle pattern:
- Two diverging trendlines (one ascending, one descending)
- Formed during periods of increased volatility and uncertainty
- Indicates potential breakout (bullish or bearish)
- No inherent directional bias
The expanding triangle pattern is often seen as a continuation pattern, meaning that the eventual breakout is expected to occur in the direction of the preceding trend. However, it’s essential to note that this pattern can also lead to a reversal, especially if the preceding trend was weak or the breakout occurs in the opposite direction.
Trading the expanding triangle chart pattern can be challenging due to its rarity and the increased volatility associated with it. However, traders can employ the following strategies to capitalize on potential breakouts:
Breakout Strategy: This is a common approach for trading the expanding triangle pattern. Traders wait for a clear breakout, either above the descending resistance trendline or below the ascending support trendline. Once a breakout is confirmed, typically accompanied by a significant increase in trading volume, traders can initiate positions in the direction of the breakout.
Trend Continuation Strategy: If the expanding triangle pattern emerges during an existing trend, traders may choose to trade in the direction of the preceding trend. For an uptrend, they would look for a breakout above the descending resistance trendline, while for a downtrend, they would seek a breakout below the ascending support trendline.
Mean Reversion Strategy: Some traders may opt to take a mean reversion approach, particularly when the expanding triangle pattern is forming during a period of increased volatility. They may look to enter short positions near the resistance trendline and long positions near the support trendline, anticipating a reversion to the mean or a consolidation within the pattern.
Volume Analysis: Closely monitoring trading volume is crucial when trading the expanding triangle pattern. A significant increase in volume during the breakout can confirm the strength of the move and provide additional confidence in the trade setup.
Volatility Strategies: Due to the increased volatility associated with the expanding triangle pattern, traders may consider employing volatility-based strategies, such as selling options or using volatility-based indicators to time their entries and exits.
Conclusion
Triangles are important trading patterns that technical traders should all be familiar with. Even if you do not decide to trade the pattern, seeing the formation on the chart can give an edge to your trading plan. Always keep solid risk management in place and only trade patterns you fully understand.
