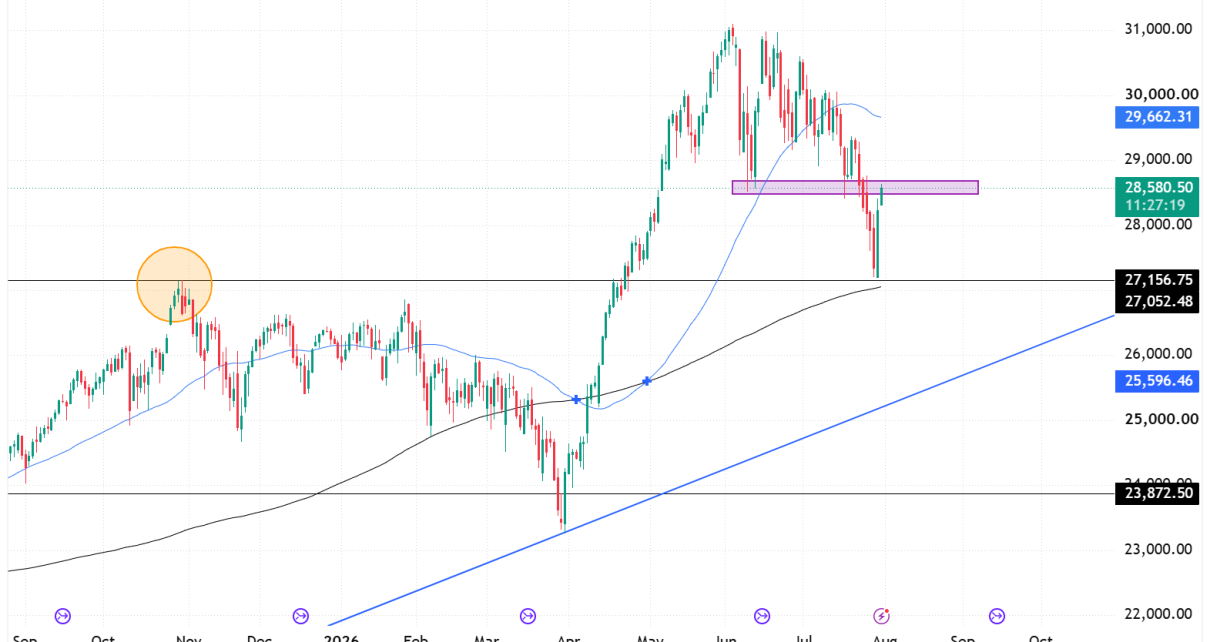
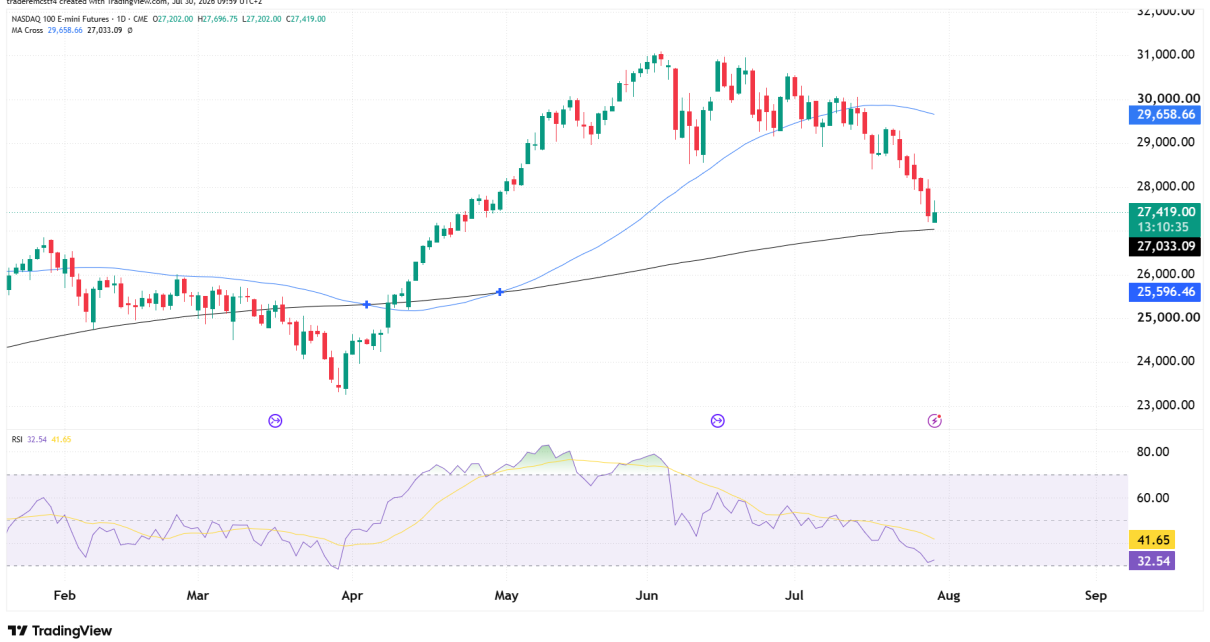
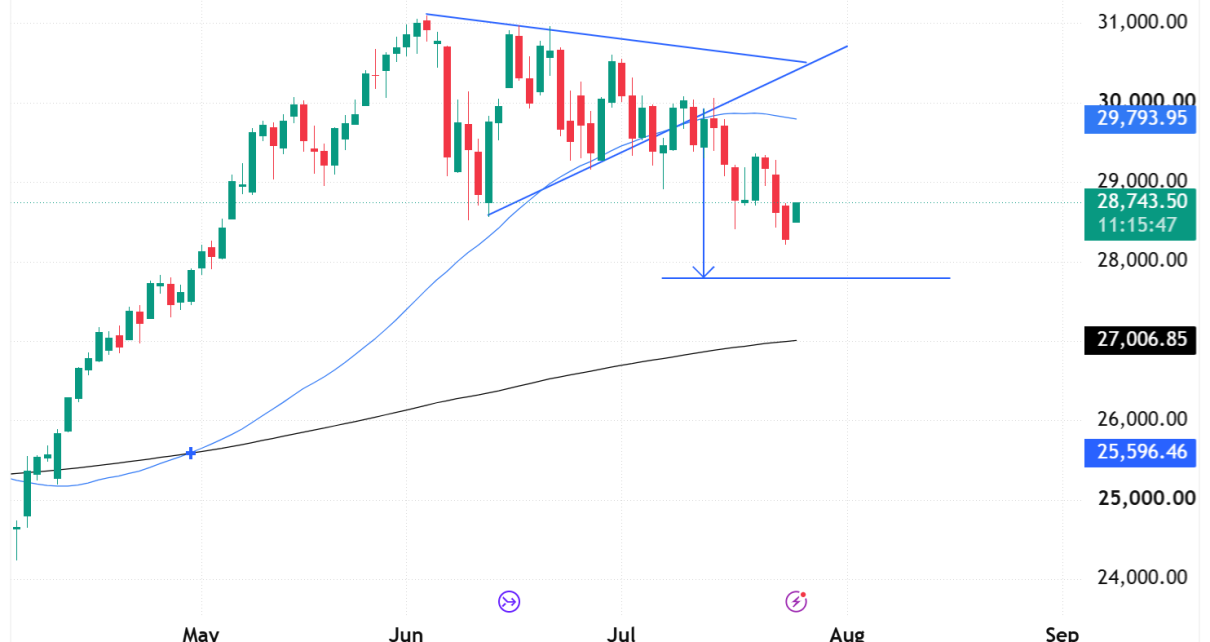
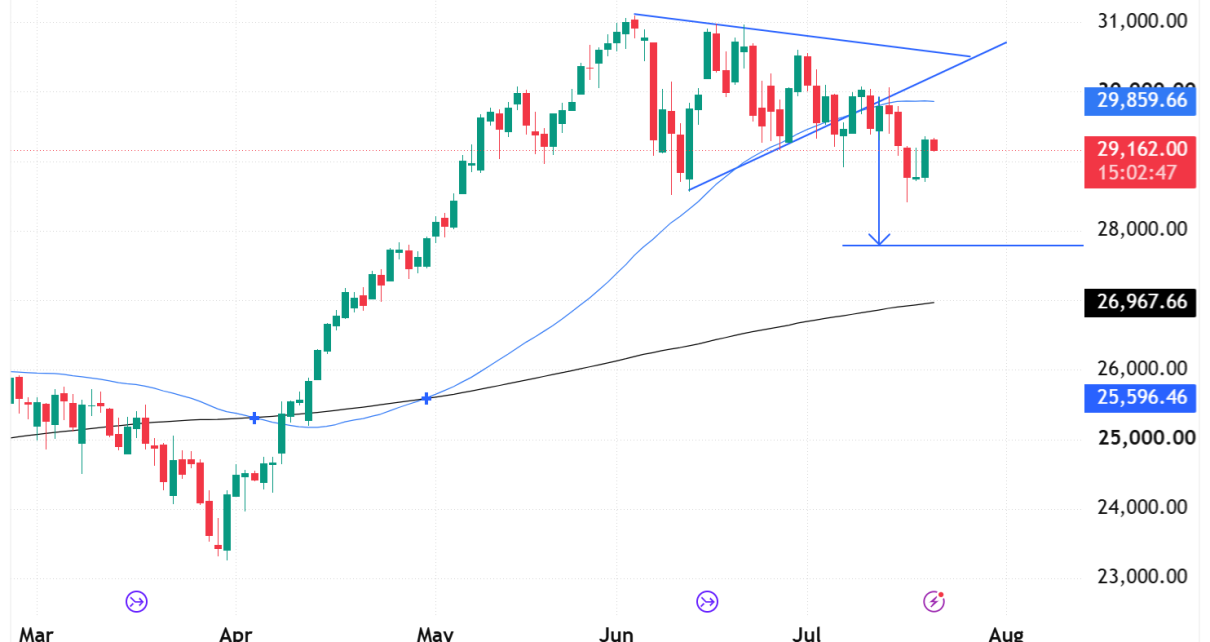
Introduction S&P 500 E-mini futures (ES) saw a sharp drop followed by a strong bounce after price tested the 200-day moving average near 6,620. The move occurred after unfortunate escalations in the Middle East where crude oil inventories were attacked. The reaction in equities shows how quickly markets can shift into risk-off mode when geopolitical Read More…
Mastering Risk Management in Funded Trading Accounts
Key Takeaways Understanding Risk Rules in Funded Trader Programs Funded trader programs like OneUp Trader allow traders to trade with capital and buying power that otherwise would be very difficult for them to attain. Some accounts allow traders up to $250K and a 25-contract max position size. On top of that, traders never risk their Read More…
Crude Oil (CL) Technicals – Weekend Shock Sends Oil Vertical
Introduction Crude Oil futures (CL) exploded higher after the weekend, with price ripping from the mid-$60s to above $100. On the daily chart, we can see a violent repricing, and moves like this almost always come from a major catalyst rather than from technicals alone. The chart shows a market that had been sitting for Read More…
Bitcoin (BTC) Technical Analysis 6 March 2026
Introduction Bitcoin futures (BTC) have been under heavy pressure since the late 2025 highs, with price falling sharply from the $120,000 region down toward the $60,000–$70,000 demand zone. BTC is down 44% since October of 2025. The sell off accelerated through February, pushing BTC well below its key moving averages and confirming a clear loss Read More…
S&P 500 (ES) Technical Analysis 6 March 2026
Introduction The S&P 500 E-mini futures (ES) continue to consolidate below the all time high of $7,000. The sideways price action has been going on since October of 2025 with no real signs of it coming to an end any time soon. Even the escalation in the Middle East hasn’t touched the US equity markets Read More…
Japanese Yen Technical Analysis 5 March 2026
Introduction The reason we are looking into the Japanese Yen futures (JPY) today is that there could be a high probability of a bullish trade. We are currently testing a major long-term support zone near 0.00630–0.00635, an area that has held since July 2024. With the current situation in the Middle East, this could be Read More…
Gold Futures (GC) Technical Analysis 4 March 2026
Introduction Gold futures (GC) continue to push higher during the crisis in the Middle East as market participants scramble for safe havens. The yellow metal has been an outperformer this year as well as last, and there seems to be no signs of it stopping. Traders who have been looking to buy the dips have Read More…
S&P 500 (ES) Technical Analysis 4 March 2026
Introduction S&P 500 E-mini futures (ES) have started to lose upside momentum after repeatedly failing to break the 7,000 resistance zone, which was its all-time high. The market is now drifting lower toward the 6,800 region, with the developments in the Middle East having no major effect on US equities. The strength of the Dollar Read More…
U.S. Dollar Index (DXY) Technical Analysis – Follow-Up
Recap From Yesterday In yesterday’s DXY technical analysis, we highlighted: Today’s price action confirms the bounce is gaining traction. What’s Changed Since Yesterday? Strong Impulsive Move Higher The momentum is accelerating as the conflict in the Middle East continues to escalate. From here, the next most obvious level that comes into focus is the 100 Read More…
Crude Oil (CL) Technical Analysis – Follow-Up After Breakout
Quick Recap From Yesterday In yesterday’s crude oil technical analysis, we saw a big jump in the price after the weekend’s developments in Iran. Here is a snapshot: The candle from yesterday also closed firmly green after the gap up. After the close, price opened lower but still in the range of the previous candle Read More…


