- Price bounces off the Parabola.
- The Cup & Handle target has been hit.
- ES maintains its bearish outlook and potential targets to note.
The Cup & Handle From Last Week
Last week we reviewed the Cup and Handle Pattern on the 1 Hourly ES chart here. Target 1 was met as the price bounced off the Parabola too. The Parabola may likely be tested again in the future, so any rallies we see could be dead-cat bounces. We’ll be looking to short into these price rallies.

Bearish Outlook Remains And Targets To Aim For
Since there is still no sign of the Fed changing its monetary policies regarding interest rate hikes, we see any rally as an opportunity to short. Please ensure that you are monitoring your risk; the analysis done in these articles is not for extremely short-term traders using tight stop losses. We are looking at probabilities and where we think the market may likely trade to in the near term. Our readers need to understand this important fact.
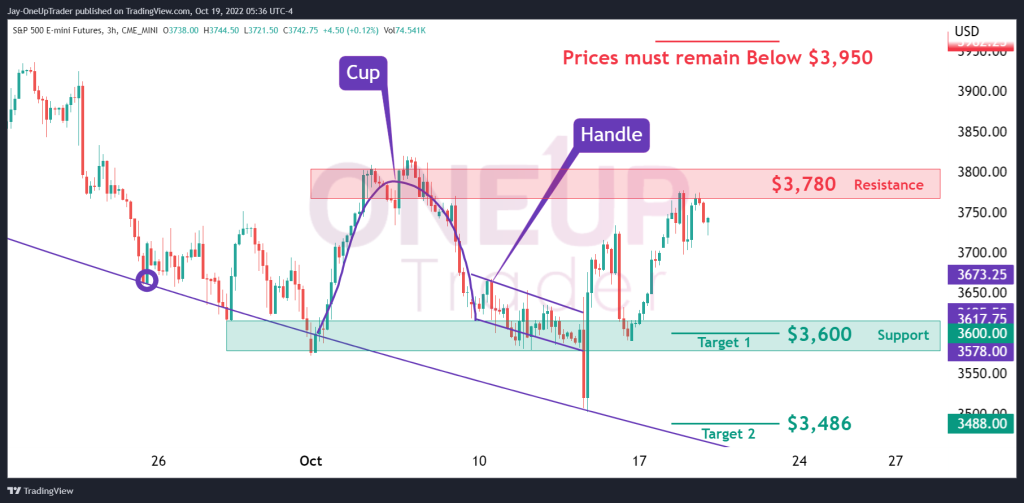
The minor resistance zone ($3,780) on the chart below is vital to keep an eye on. Ideally, it could be the short-term top before the next leg down if we see sufficient selling pressure. We have new price targets of $3,600 (Minor Support) and $3,486 (Near Parabola).
For these short-term targets to remain valid, prices must stay below $3,950.