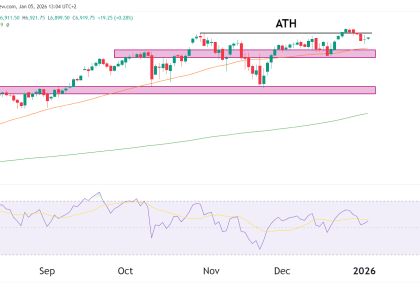
Market Overview Technical Analysis

Technical Analysis: E-mini S&P 500 (ES) Retraces Into Gaussian Channel

ES price retraces into a liquidity zone at the same price as the Gaussian midline. Core inflation (CPI) and year-over-year inflation reports will be released tomorrow. A potential short-term 1-2-3 bearish pattern formation on the hourly chart. Daily Chart Analysis Looking at the daily chart, there are a few developments we can note. Toward the Read More…

consumer confidence index
Market Overview Technical Analysis

Technical Analysis: E-mini S&P 500 (ES) Rallies Off Lows

The weekly chart shows a bullish false-break candlestick formation. Analyzing the support/resistance band on the 4-Hourly chart. A look into the 1-Hourly trend channel. False Break Candle The false break candle strategy is one we are familiar with at OneUp Trader, and for a good reason – its reliability! The pattern works because when the Read More…