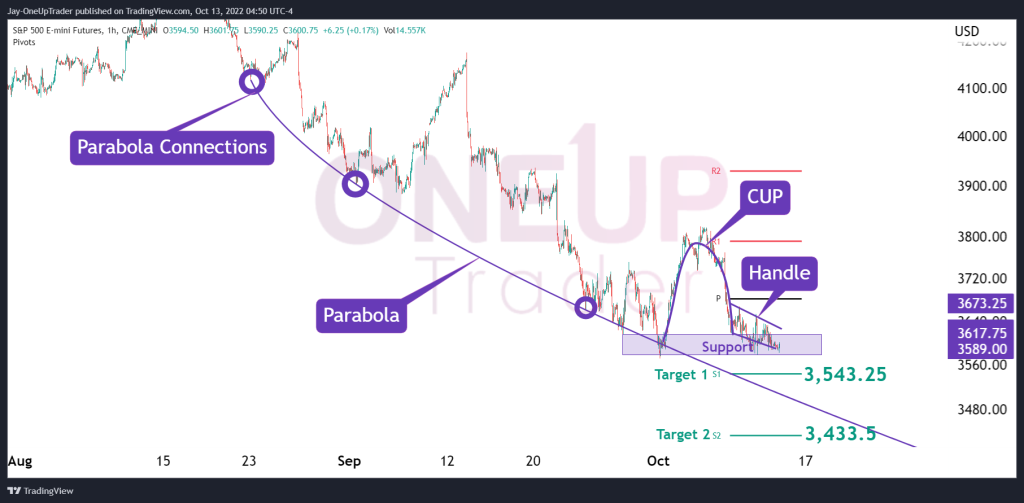
- Short-term targets using the Parabola
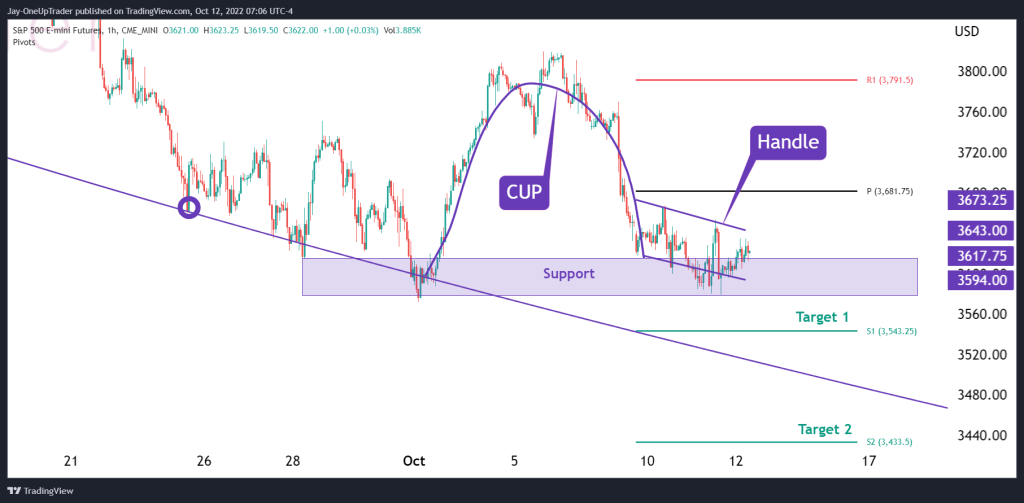
- The Cup & Handle analysis
- Possible bearish targets are $3,543.25 and $3,433.5
The Parabola
Parabolas are not very popular tools in technical analysis, but they can be extremely useful in determining trends and targets that many other market participants cannot see. There is a parabolic curve with three connection points going back almost a month. Our first target is very close to the Parabola, and it falls on the Pivot Point S1 at $3,543.25.
Inverse Cup & Handle
There is an inverse cup & handle forming on the hourly chart. The handle is forming at the moment, and if the pattern does play out, we can search for potential bearish targets at $3,534 and $3,433. Here, you can learn more about the cup & handle pattern from our Instagram page.
Summary
Generally, we see more downside in the market as most major indices have broken below the yearly lows. We are likely to see more bearish price actions for the next few weeks, and today’s CPI report will also give us a good picture of what the Fed may do going forward.