

Introduction
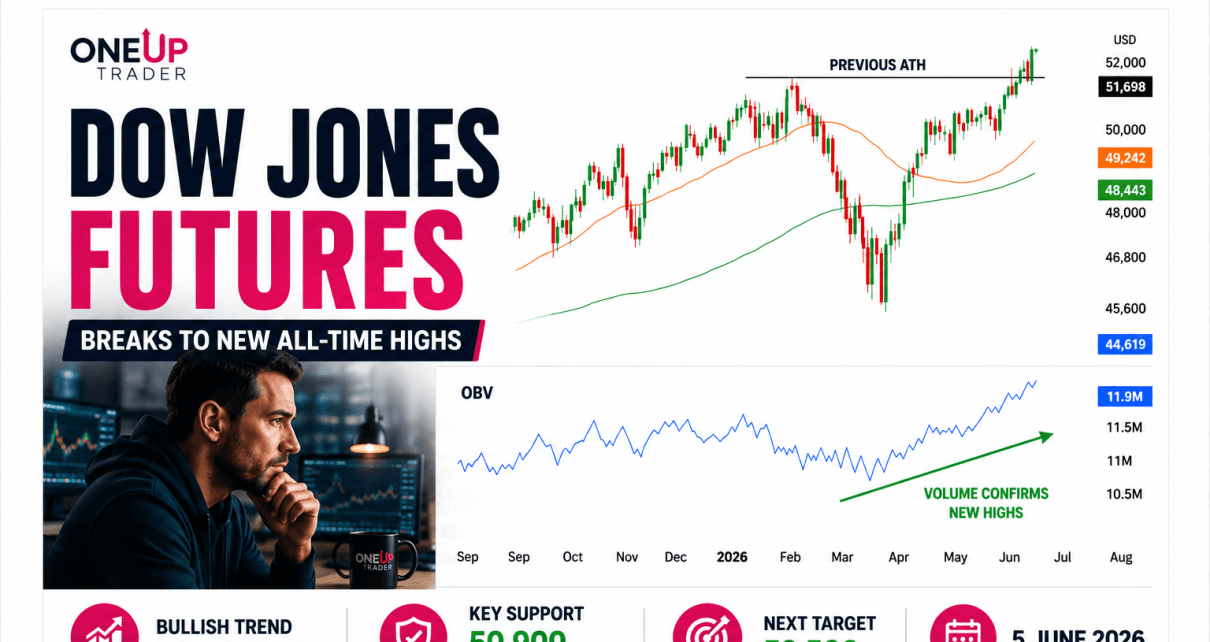
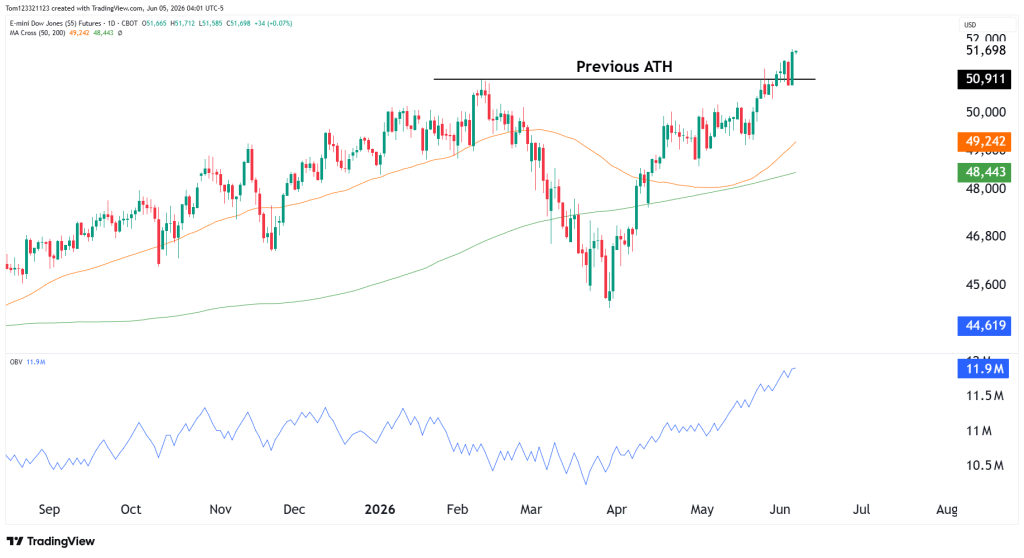
Dow Jones futures continue to reward buyers after breaking above the previous all-time high that we highlighted in our recent analysis. Since our last update, YM has not only held above the previous ATH at 50,900, but has also continued pushing into fresh record territory.
Dow Jones Futures Trend Analysis
The structure remains bullish right now. In our previous analysis, we noted that the market was consolidating above the breakout zone rather than immediately accelerating higher.
Current technicals show:
- The 50-day moving average near 49,242
- The 200-day moving average near 48,443
- Current price trading around 51,700
- Previous all-time high near 50,900 now acting as support
The break above the previous high is the most important thing we see on the chart right now. YM is also lagging the other indices by a decent margin so there is room for catch up and a possible long breakout trade at current levels.
Basically, as long as the previous ATH holds as support, we should see the market move higher from here.
Volume Continues Supporting The Move
Another bullish sign comes from the On-Balance Volume (OBV) indicator.
While price has been making new highs, OBV has also continued climbing and recently printed fresh highs of its own. This shows participation remains strong behind the rally.
Estimated Probabilities for Dow Jones Futures
| Scenario | Estimated Probability | Market Interpretation |
|---|---|---|
| Continued breakout toward 52,500 | 60% | Buyers maintain momentum above support |
| Consolidation above 50,900 | 30% | Market pauses while preserving bullish structure |
| Failed breakout below 50,900 | 10% | Sellers regain control and trigger deeper pullback |
Key Support and Resistance Levels
Major Resistance Levels
- 52,000
- 52,500
- 53,000
Major Support Levels
- 50,900 previous all-time high
- 50,000 psychological support
- 49,242 (50-day moving average)
YM Possible Trades
Bullish Continuation Trade
As long as YM remains above the previous all-time high, buyers continue controlling the trend. A sustained move above current highs could open the door for another leg higher toward the 52,500 region.
Pullback Trade Setup
Even strong trends require periods of consolidation. Pullbacks toward the 50,900 support zone may continue attracting buyers if the market maintains its current structure. Higher lows and bullish reactions near support would continue reinforcing the uptrend.
Failed Breakout Scenario
While this remains the lower-probability outcome, traders should continue monitoring the 50,900 level closely. A decisive move back below the breakout zone would be the first indication that bullish momentum is beginning to weaken.
