- The Fed raised interest rates by 25 basis points, sending equity markets higher.
- Technical analysis point toward a strong bullish bias.
- Utilizing the stochastic indicator to enter into trades on retracements.
The Fed
The Federal Reserve raised its key rate by a quarter point Wednesday, bringing it to the highest level in 15 years as part of an ongoing effort to ease inflation by making borrowing more expensive.
As a result, equity markets have rallied, and the NQ chart looks bullish.
How can traders and investors position themselves moving forward, and what are the key levels to watch out for?
Technical Analysis
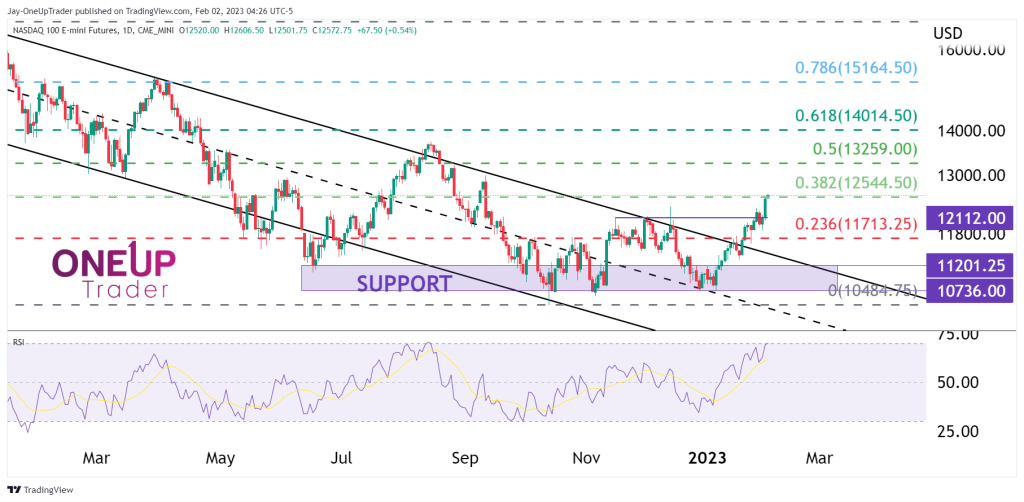
I have discussed the downtrend channel in these articles multiple times, and now we can confirm that the channel has officially been broken to the top side. Bulls are in complete control over speculation that interest rate policy will not be as aggressive and that inflation is moving toward the 2% target the Fed has set out for.
The key levels to watch are the Fib 0.382 level and the Fib 0.50 level. This is a Fibonacci retracement from the recent macro high before the downtrend and pullback of 38% occurred.
The RSI has just crossed into the overbought territory, but it’s actually a bullish sign. It shows us how strong the buying pressure is. It does not, however, mean that we need to chase the market. We should simply wait for a retracement before entering into long positions.
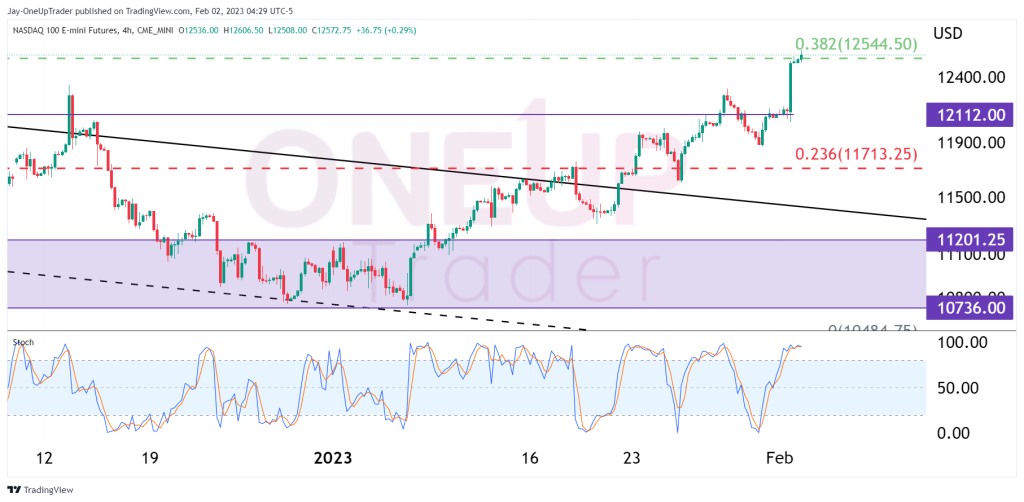
What can we do to enter in on a pullback?
Moving down into a 4-hour chart or lower, we can use a few strategies to initiate long positions keeping in mind the long-term trend. I have applied a stochastic to the 4 hourly chart. Waiting for the stochastic to drop into oversold or at least below the mid-way point, then waiting for a candle stick pattern to enter, could be an excellent way to swing trade our way up this predicted uptrend.
Summary
Fundamentals and technicals both point toward an uptrend in equity markets. The Fed seems pleased with the developments with inflation, but this is not a time to become complacent. Anything can happen, and there are still economists calling for a recession. It would be ideal to go with the trend and enter in on pullbacks without over-leveraging or being subjective in our views.