


Introduction
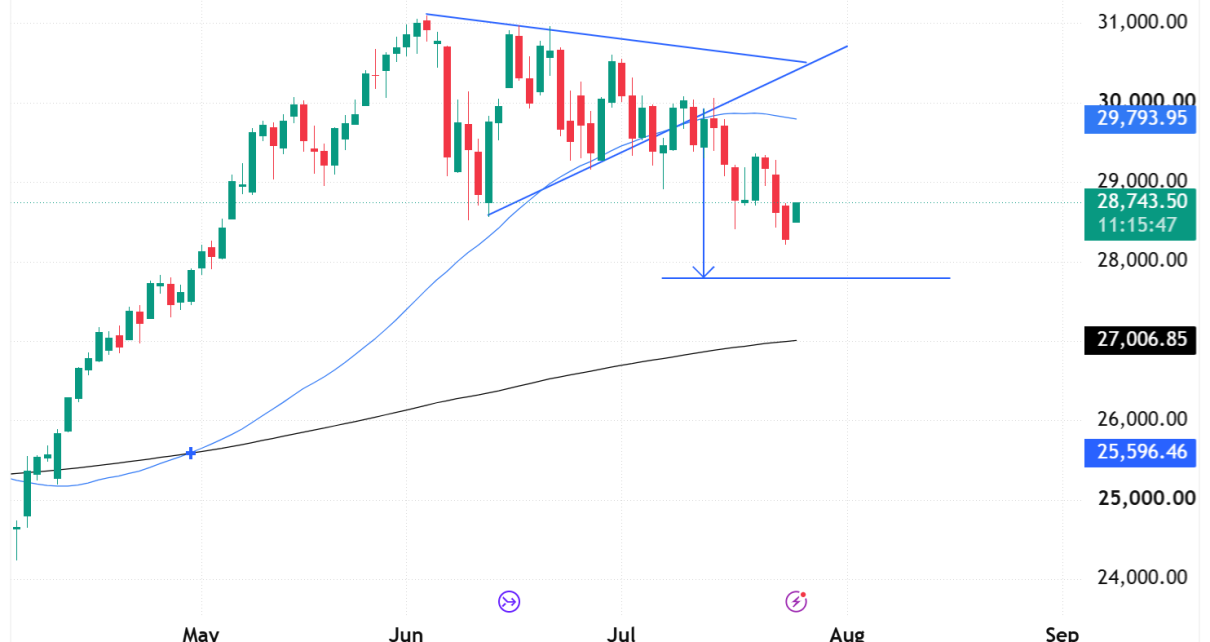
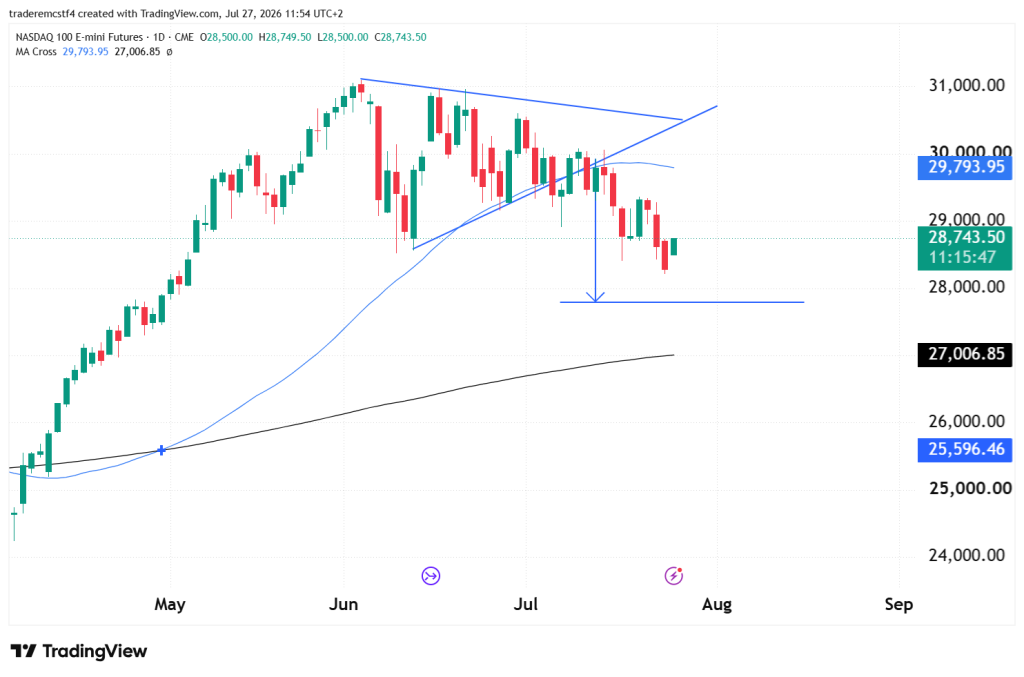
This is a follow-up to the 22 July analysis, where the rejection at 29,300 kept the breakdown intact, with 28,000 flagged as the nearer downside target and the 200-day MA further below that. That scenario has played out — NQ broke below the 17 July low, trading down to 28,200. Today’s session (Monday 27 July) is already showing buying strength, which points us in a certain direction. It shows that even after the market is taking out support levels on the daily chart, it is not strong enough to continue, and so the price reverses. NQ might be starting to show that the bears are just not strong enough to follow through with a pullback larger than 10%, so lets take a closer look at the technicals and if there are any trades available.
Nasdaq 100 Futures Trend Analysis
Price is now testing a support zone (roughly 28,050–28,700) at the same time it’s sitting right at the underside of the descending trendline from the June high. That’s two forms of resistance/support meeting in the same area, which makes today’s close worth paying attention to — a bounce here would have more technical weight than a bounce from an arbitrary level. It would also mean we have a clear false break candle entry on the daily chart.
The 50-day MA (29,793.46) remains well above price and is now turning down slightly, while the 200-day MA (27,006.74) continues to rise slowly and is still the larger downside reference point if this support zone doesn’t hold.
Key Levels
| Level | Notes |
|---|---|
| 29,793 | 50-day MA, still well above price |
| 28,700 – 29,000 | Descending trendline from the June high, now overlapping with the top of the support zone |
| 28,501 | Today’s low |
| 28,050 | Lower boundary of the current support zone |
| 27,007 | 200-day MA |
Possible Trades
Scenario 1: Support zone holds, false break candle long entry. If price closes and remains above $28,700 then there is a possible long entry betting on this pullback being dun and dusted.
- Entry: Above 28,700
- Stop: Below 28,000
Scenario 2: Support zone fails, continuation toward the 200-day MA The broader trend remains bearish, and a clean break below 28,050 would lean toward today’s close was a pause rather than a genuine reaction.
- Trigger: Daily close below 28,050
- Target: 27,007 (200-day MA)
This analysis is provided for educational and informational purposes only and should not be considered financial or trading advice. Trading futures, forex, and other leveraged financial instruments carries a high level of risk and may not be suitable for all investors. Past performance is not indicative of future results. Before making any trading decisions, conduct your own research, assess your risk tolerance, and consult with a qualified financial advisor if necessary.

