Introduction
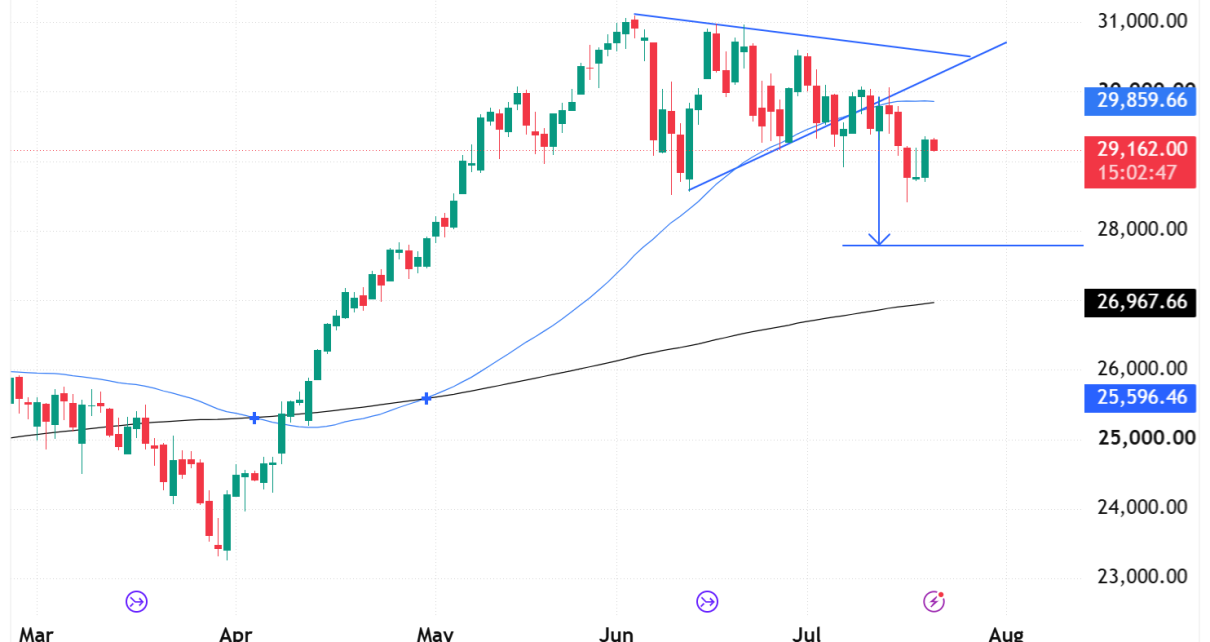
This is a follow-up to the 17 July analysis. NQ broke below the support of the triangle and the 50 MA, and if we extend the target line, it brings $28,000 into play. As traders, we need to think in probabilities because nothing is certain in the markets, so let’s take a look and see if we think there is a higher chance NQ will continue to drop, or a quick bullish reversal is already upon us.
What Played Out Since the Last Call
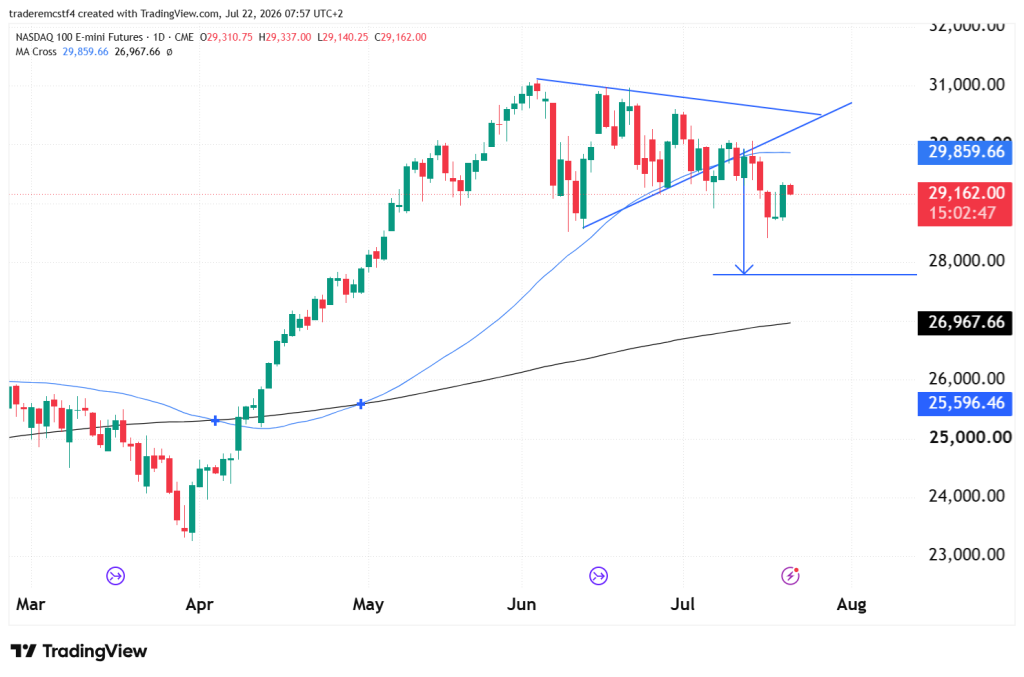
Price bounced off the 28,550 low from the last analysis, pushing as high as 29,337 on the 21st of July, just above the 29,300 level that was flagged as the trendline to reclaim. It didn’t hold. The close at 29,162, back below 29,300, means the bounce scenario played out, but the reclaim scenario did not — this still reads as a former support level now acting as resistance.
Nasdaq 100 Futures Trend Analysis
The rejection at 29,300 yesterday keeps the broader bearish case from the last analysis intact. Price remains well below the 50-day MA (29,859.66), and the measured-move target toward the 200-day MA (26,967.66) from the broken triangle is still in play. A closer level worth watching first is 28,000, which sits just below the 17 July low and would be the next objective if that low gives way again.
Key Levels
| Level | Notes |
|---|---|
| 29,859 | 50-day MA, still well above price |
| 29,300 – 29,337 | Broken trendline / today’s high, rejected on today’s test |
| 28,550 | 17 July low, first support on renewed weakness |
| 28,000 | Next support below the 17 July low |
| 26,967 | 200-day MA, still the larger measured-move target |
Possible Trades
Scenario 1: Rejection holds, renewed move lower. The rejection at 29,300 keeps the breakdown thesis intact. A break of 28,550 would put 28,000 in play first, with the 200-day MA further below.
- Entry: Bearish reaction on a break of 28,550, or on continued weakness below today’s close
- Stop: Above 29,337
- Target: 28,000, then 26,967
Scenario 2: Reclaim of 29,300 on a second attempt A decisive close back above 29,337 would suggest the bounce has more room, with the 50-day MA as the next test.
- Entry: Daily close above 29,337
- Stop: Below 29,140
- Target: 29,859
Scenario 3: Range between 28,550 and 29,300 A period of chop between the recent low and the rejected trendline is also possible before either level resolves.
This analysis is provided for educational and informational purposes only and should not be considered financial or trading advice. Trading futures, forex, and other leveraged financial instruments carries a high level of risk and may not be suitable for all investors. Past performance is not indicative of future results. Before making any trading decisions, conduct your own research, assess your risk tolerance, and consult with a qualified financial advisor if necessary.