

Weekly Chart
- The NASDAQ 100 E-mini Futures have exhibited a strong uptrend on the weekly chart, as evidenced by the sequence of higher highs and higher lows.
- The MACD indicator is above the signal line and positive, which supports the ongoing bullish momentum. However, the histogram shows a slight decrease in momentum as the bars get shorter.
- The Average True Range (ATR) has been relatively stable, indicating consistent volatility in the market.
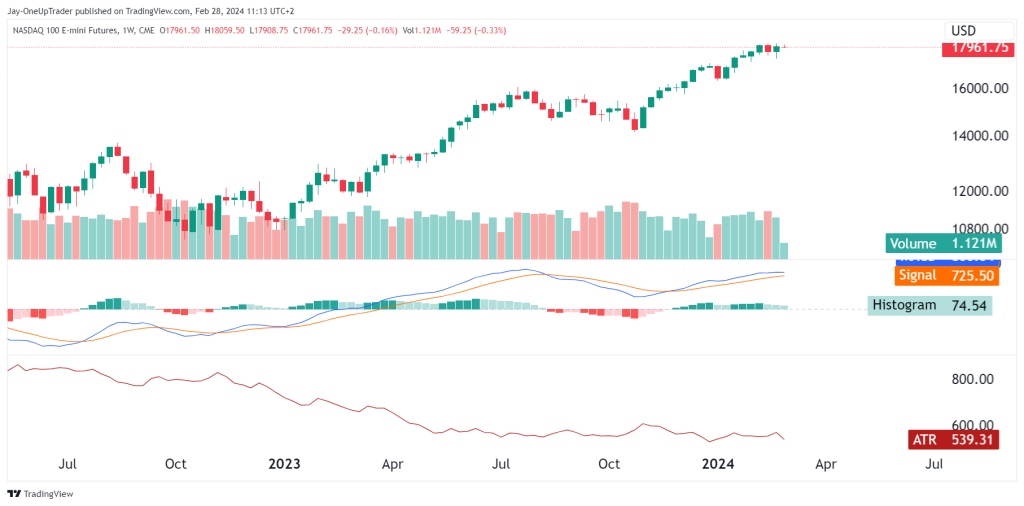
Key Levels to Watch on the Weekly:
- Resistance: The current price level around 17961.75 serves as immediate resistance. A push above this could lead us to test new highs.
- Support: The key support level lies around the 17000 mark, aligning with previous consolidation areas.
Daily Chart
- The daily chart shows a possible rising wedge formation, which can often be a reversal pattern if the price breaks down.
- We’re seeing bearish divergence with the RSI, as the price makes higher highs while the RSI fails to follow, indicating weakening bullish momentum.
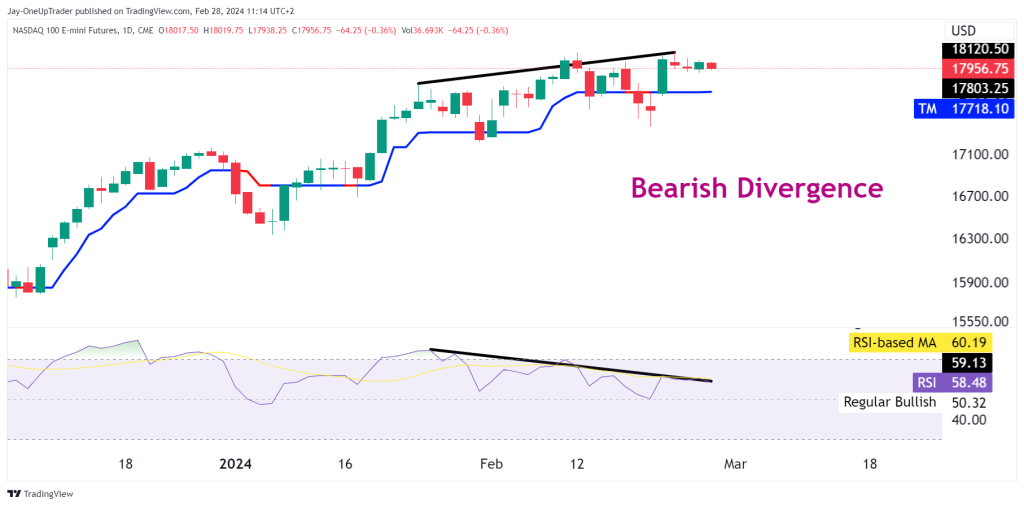
Key Levels to Watch on the Daily:
- Resistance: The upper trendline of the wedge near 18120.50 is the immediate resistance.
- Support: The 50-day moving average at 17718.10 may act as a short-term support level.
Potential Trades:
- Bullish Scenario: If the price continues to hold above the 50-day moving average and breaks through the upper trendline of the wedge, we could enter a long position targeting the 18120.50 level. Our stop loss would be placed below the 50-day moving average.
- Bearish Scenario: A break below the 50-day moving average could signal a short trade opportunity, targeting the next support level around 17000. In this case, a stop loss could be placed above the 50-day moving average to minimize potential losses.
It’s essential to monitor these levels and adjust strategies accordingly. The rising wedge and RSI divergence should be watched closely for signs of a potential reversal. Remember to manage risks effectively, as markets can always move contrary to expectations.