



15 October 2026 | Daily and hourly charts
Introduction
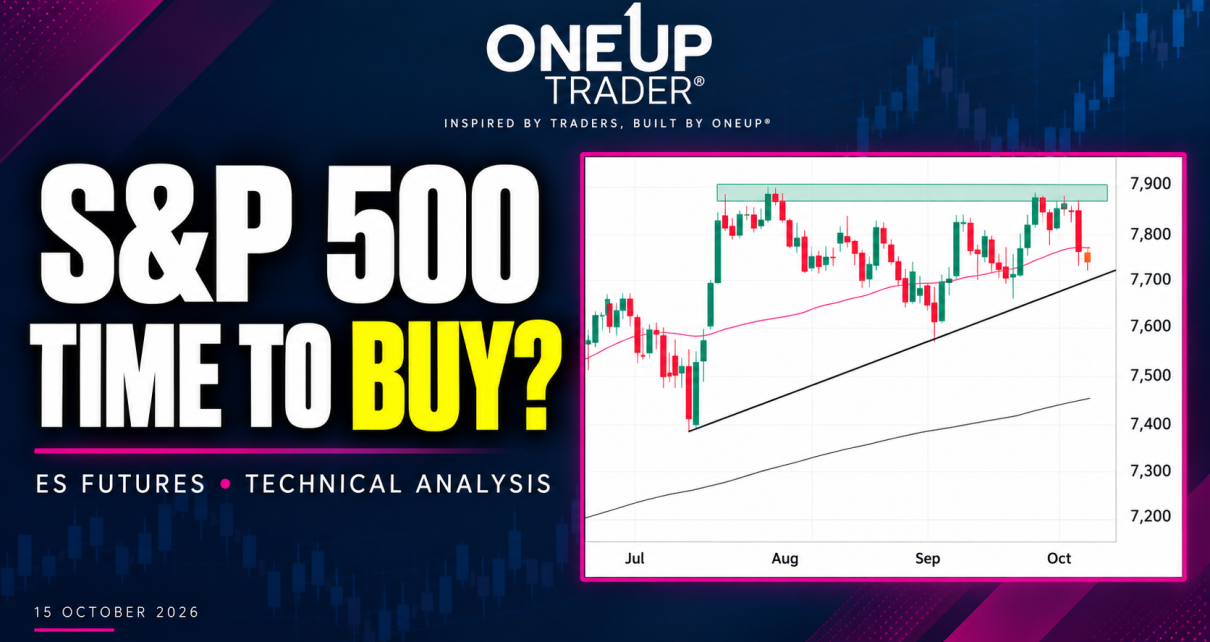
S&P 500 futures have pulled back after another rejection near the 7,890 resistance area, bringing a potential buying opportunity into focus. The broader daily uptrend remains intact, and the latest decline gives traders a reason to start watching the hourly chart for long setups.
The question now is whether buyers can establish a higher low and recover the ground lost during the selloff. Hourly momentum is beginning to turn, but price still needs to confirm that buyers are taking control.
Daily Chart: The Broader Uptrend Still Holds
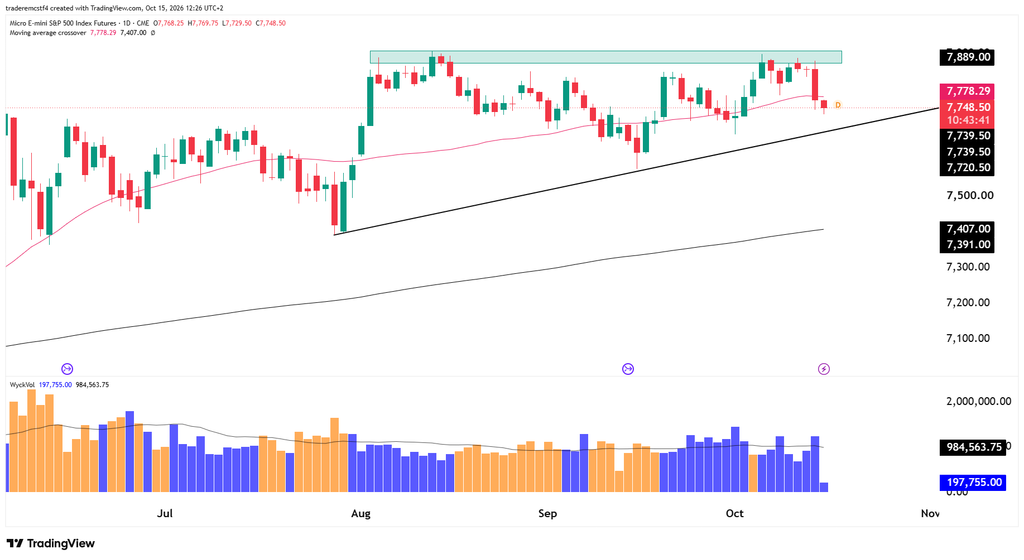
The rising trendline connecting the late-July and September lows remains an important part of the bullish structure. Price is still above that line, and the tests near the upper resistance zone mean that if we do see a breakout, it could move quickly and make new all-time highs.
The latest pullback has also pushed price beneath the 50 moving average, currently near 7,778. Recovering that average would be an encouraging first step, particularly if buyers can then hold above 7,800.
For now, we are seeing a buying opportunity as long as price remains above the rising trend line on the daily chart.
Hourly Chart: Watching for a Long Setup
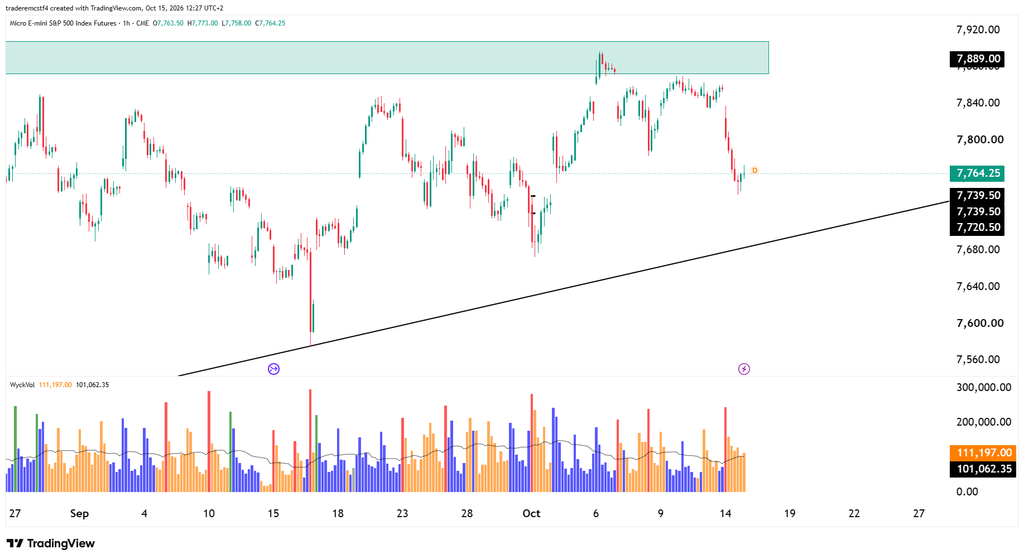
The hourly chart shows the pullback more clearly. Price has fallen sharply from the 7,850 area, while the stochastic has dropped into oversold territory.
The next thing to watch is an hourly higher low followed by a break above the most recent rebound high. That would provide stronger evidence that the selling pressure is easing.
A recovery through 7,780–7,800, followed by a successful retest, would strengthen the long setup further. It would put price back around the daily moving average and show that buyers can hold some of the recovered ground.
Possible Long Trade Setup On S&P 500 (ES)
An earlier entry would depend on the hourly chart forming a clear higher low and then breaking its local rebound high. The stop would sit below the low that supports that setup, with enough room for normal price movement.
A more patient approach would wait for price to reclaim 7,780–7,800 and hold that area on a retest. If successful, the next upside areas would be 7,840–7,860, followed by the larger resistance zone around 7,890.
The distance to the first resistance needs to justify the risk to the stop. If confirmation arrives only after a large bounce, waiting for another pullback may offer a better entry.
The bullish case would weaken if the market keeps making lower hourly lows and fails to recover resistance. For now, the daily trend gives buyers a reason to pay attention, while the hourly chart will determine whether a usable entry develops.
Sign Up For Your Evaluation Today!
This analysis is for educational and informational purposes only and does not constitute trading advice or a recommendation to buy or sell any futures contracts. Futures trading involves significant risk and may not be suitable for all investors. Always conduct your own research and consult with a licensed financial professional before making trading decisions.