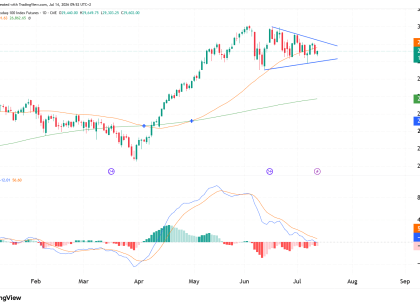
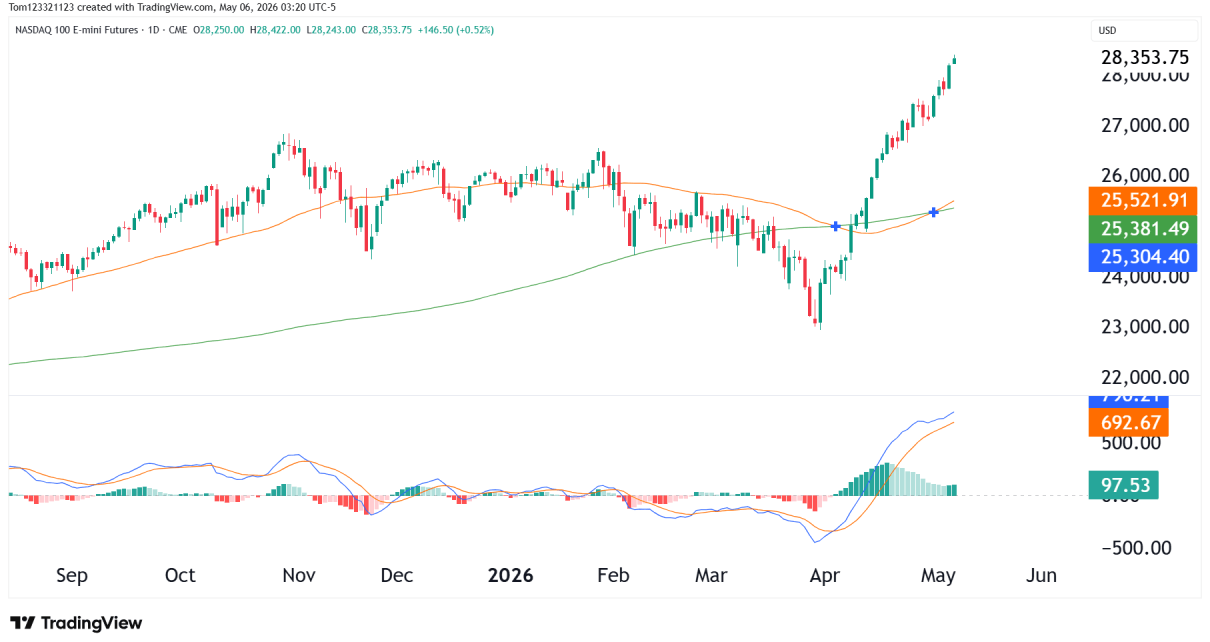
Technical Analysis Moving Averages: Recent Price Action: The price has recently faced resistance near the 50-day moving average as bulls tried to push prices higher and has pulled back slightly. This rejection from the 50-day moving average shows selling pressure at these levels. Market Sentiment: The overall trend before the recent pullback in July was Read More…
Tag: E-mini Nasdaq 100 (NQ) futures
NASDAQ 100 (NQ) Trade Opportunities
Important Points All-Time High (ATH) Resistance: Support and Resistance Levels: Price Action: Trade Opportunities: Bullish Scenario: Bearish Scenario: Risk Management: Final Call: Overall, the chart is showing a bullish bias, with a key decision point around the ATH. Traders should watch for either a breakout or a rejection to determine the next move.
NASDAQ Futures (NQ) Surge Incoming?
Price Action and Trend NQ, like all other equity markets, has been in a strong uptrend since October 2023. However, we’ve recently seen a sharp pullback from the all-time high of around 20,983.00, and now could be the time to look to take long positions. Support and Resistance Moving Averages The price is currently between Read More…
NASDAQ Futures (NQ) Technical analysis
Weekly Chart I have put a volume profile indicator onto last weeks trading which is shown in the weekly chart below. Price is sitting now just above the support where last weeks candle closed. The Point of control line is holding the price up for now and after the recent dip in the US equity Read More…
NASDAQ Futures (NQ) Massive Bullish Candle
Introduction The Nasdaq e-mini futures (NQ) painted a huge bullish candle from last Friday in the form of a doji that is busy confirming a morning star pattern. The price has already pushed above last Friday’s high, confirming the bullish price action. The doji from Friday also bounced right off the 100 MA. This could Read More…
NASDAQ (NQ) Key Technical Analysis Trades
NASDAQ Chart Overview In this chart, we’re looking at the NASDAQ 100 E-mini Futures (10-minute intervals) along with the Simple Moving Average (SMA), Relative Strength Index (RSI), and Volume Profile Visible Range (VPVR) indicators. Price Action and Technical Patterns Channel and Breakout Analysis We can see that the price was trading within an ascending channel, Read More…