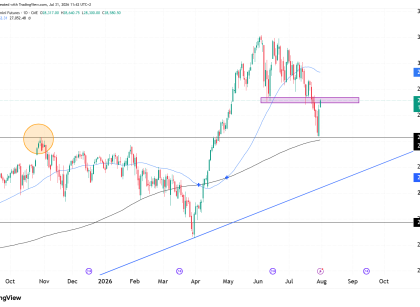
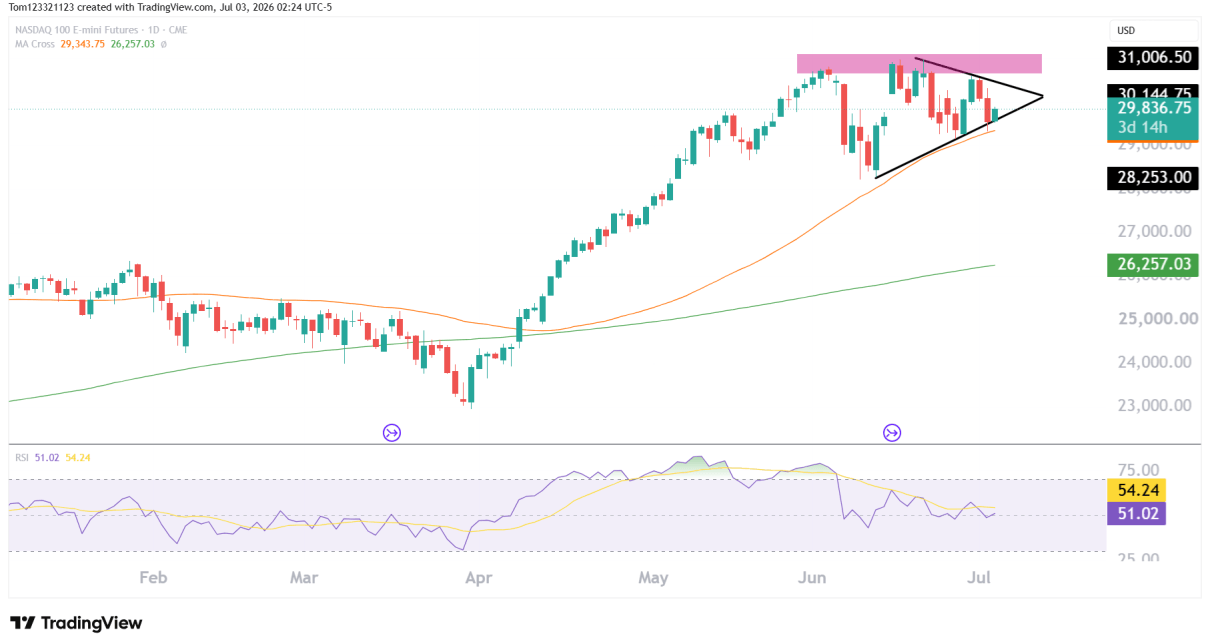
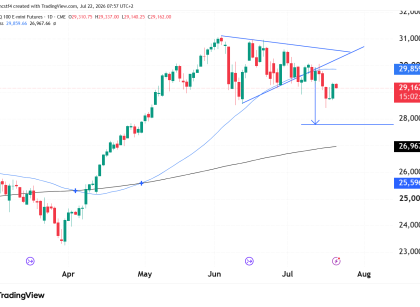
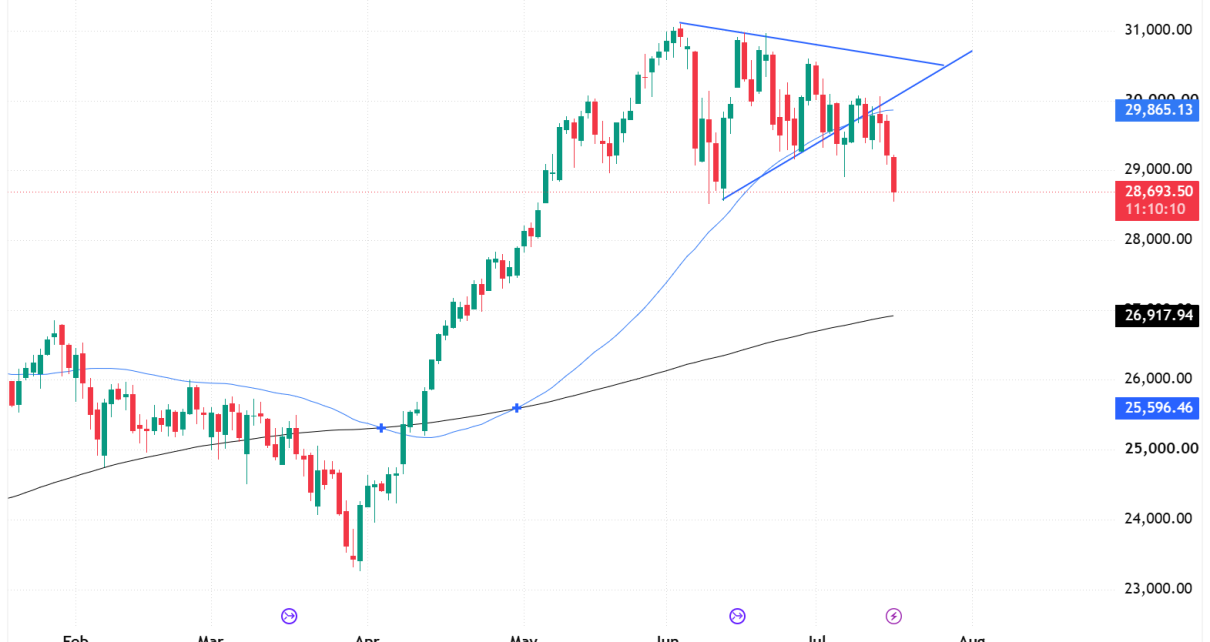
Nasdaq 100 index futures (NQ)
Technical Analysis

Nasdaq Futures (NQ) Technical Analysis: Strong Bullish Momentum Continues

Introduction: NQ has shown remarkable resilience, surging 53% since its lows in October last year and currently hovering only 7% below its all-time high. With the 50-day moving average sloping upward and the Relative Strength Index (RSI) sitting at 60, bullish momentum is evident. Moreover, the Accumulation/Distribution Line (ADL) is at 1400, indicating increased buying Read More…

Nasdaq 100 futures (NQ)
Technical Analysis

Nasdaq futures (NQ) surge 8% is less than a week

Technical Recap The last time we did technicals on NQ was June 9th. Bulls looked steadfast on hitting the 78% Fib level at $15,147, which has officially happened. The Nasdaq rallied 8% since June 9th, and doesn’t look like it’s slowing any time soon. Targets From here, there is very little evidence for a bearish Read More…

Nasdaq 100 index futures (NQ)
Technical Analysis

Nasdaq futures (NQ) continue rampant upward surge

Price action If we look at the weekly time frame, the chart almost looks vertical. NQ has rallied hard, with big tech stocks like Apple hitting new all-time highs. It shows you that even in an environment of high-interest rates, the market can still do strange things. Sticking to technicals is the way forward. Weekly Read More…