


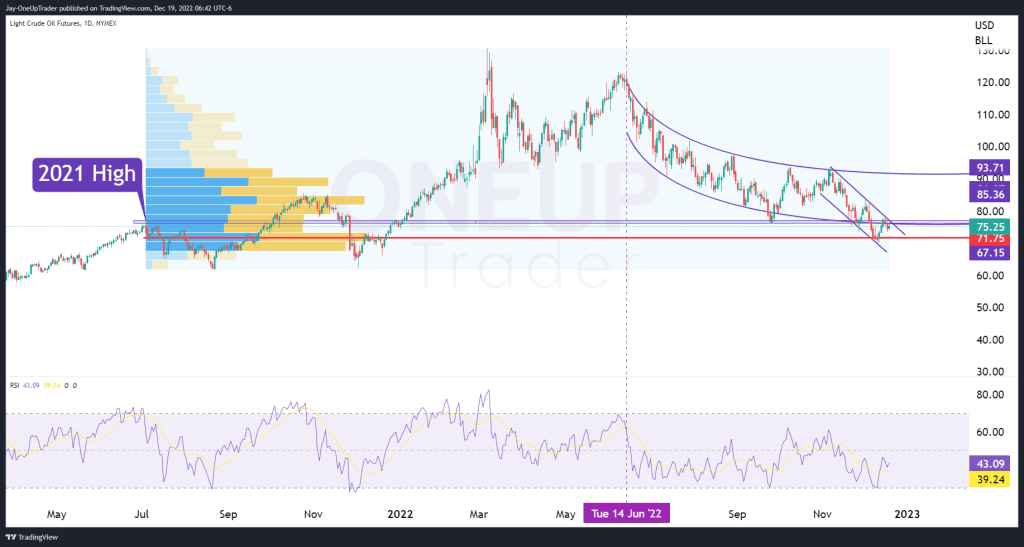
- A look at the 2021 high that is a significant support and resistance level
- The RSI remains bearish with no signs of a reversal
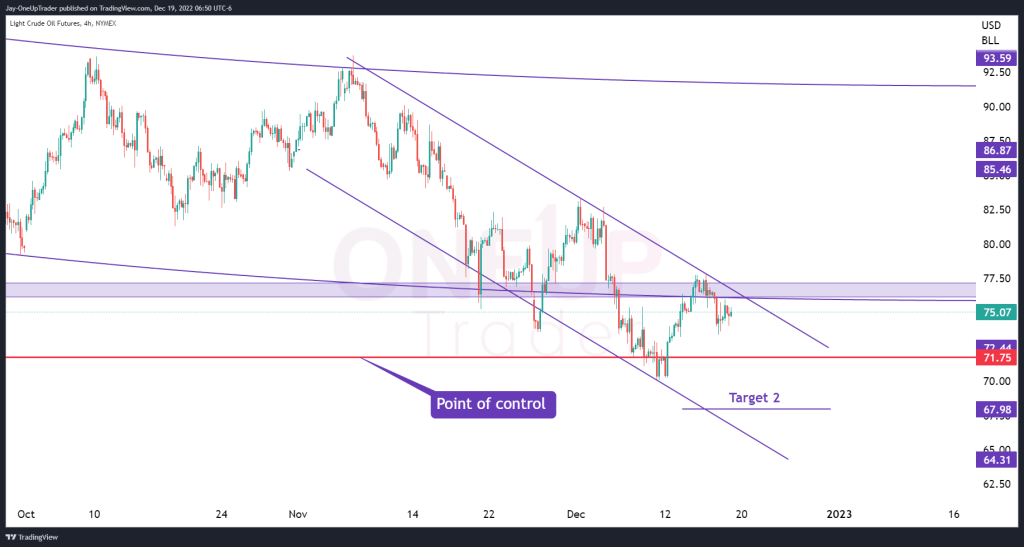
- Potential bearish targets from 1-2-3 reversal and trend channel analysis
Long Term Outlook
We have been tracking the CL price for some time now as we watch the daily trend continue with its bearish momentum. Here are a few important technicals we must be aware of:
2021 High Support/Resistance
The 2021 high has formed a solid liquidity zone. The CL price has bounced out of this zone a few times before eventually closing below it on December 6th. Last week we saw the price rally back into the zone and it acted as strong resistance with the market reversing immediately back below the level.
RSI
The RSI is showing positive signs for bears as we notice clear lower lows being printed on the indicator. We still haven’t seen the RSI move into the oversold territory and it’s looking likely that on the next impulse move downwards, the indicator could move into oversold at which we may see short sellers begin taking profits.
Volume Profile
If I apply the volume profile to the 2021 high to the current trading day, the point of control line is at $71.75. This has already acted as a springboard in the recent test of the level on December 9th. If we see CL dip back toward that price from its current levels at $75.23 then we can expect it to have some buying pressure but likely not enough to stop the price from making new lower lows.
Potential Targets
Dropping the time frame of CL down to a 4-hourly chart, there is a clear downtrend in place that we can define using a trend channel.
The first and most immediate target for bears would be the point of control line at $71.75. A break below that level would lead to prices likely falling toward the second target of $67.98 which is the lower range of the trend channel and the 1-2-3 reversal target mentioned in our previous article.