- The bearish target below $11,000 has been reached.
- Using Fibonacci Retracements to set potential bearish targets.
- Analyzing the yearly NQ chart alongside quantitative easing.
- 3 indicators to pay close attention to.
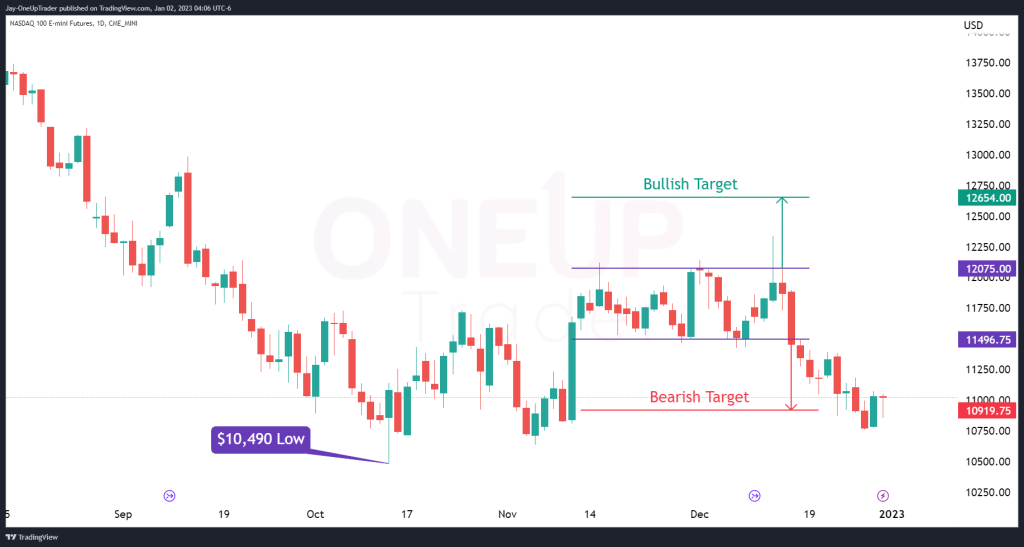
Bearish Break Of Consolidation Zone
We have been monitoring the consolidation zone on NQ now since the middle of November. Price remained in a zone between $11,496.75 and $12,075.00 before eventually breaking to the downside. The bearish target we set in the analysis done on December 15th has now been hit; NQ is trading just 4.8% away from its 2022 low at $10,490. There should be a vast amount of sell-stop orders below that support level, so if we see the price break below, NQ could dip a lot further into the first quarter of the year.
Yearly Chart Analysis
Most traders never look at the yearly chart, but it can be a great way to get an idea of where the market could head in the short term by considering candlestick patterns. By looking at the candle that formed for the year, we can analyze the price range within which the price could trade. We can also apply Fibonacci retracements from the high to the low of the candle to get possible entry points.
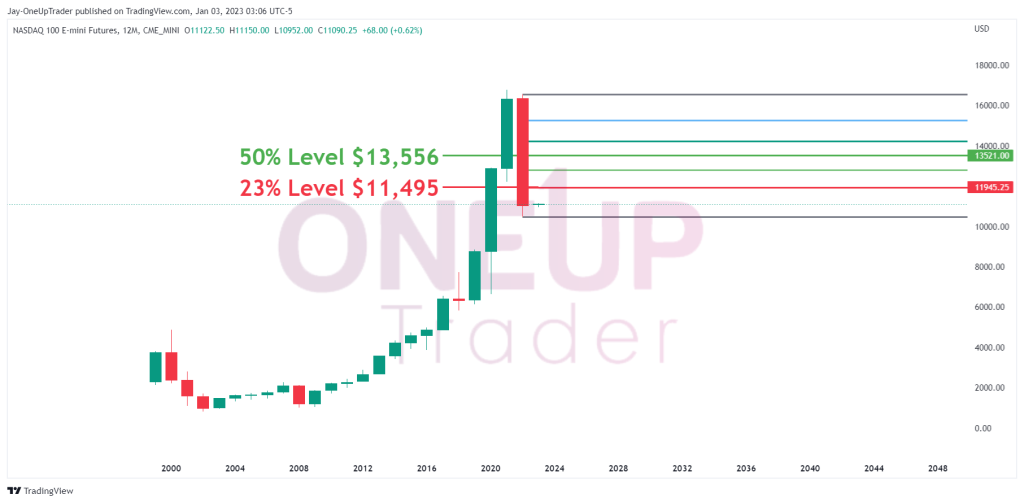
The yearly has closed with a full-bodied red candle. This is the first since 2008, which means we have seen green candles every year for 14 years except for one. Quantitative Easing (QE) has led to soaring stock markets. It’s alarming to think that the very moment the Fed steps off the gas, we see a sell-off of over 30%. It’s very plain and simple that we should not fight the Fed because of its dominance over market conditions.
What Is QE?
Quantitative easing (QE) is a monetary policy tool that central banks use to stimulate the economy by increasing the money supply. Central banks can use QE to inject money into the financial system by purchasing securities, such as government bonds, from banks, thereby increasing the banks’ reserve balances and allowing them to lend more money. QE can be used to lower interest rates, boost asset prices, and increase spending and economic activity when conventional monetary policy tools, such as cutting interest rates, are no longer effective.
I marked off the 23% and 50% levels in the chart above as potential entries for Bears if we see prices retrace there. A move above the 50% level on NQ would signal the bulls are gaining strength and could mean a bullish reversal is on the cards toward the 3rd and 4th quarters of 2023.
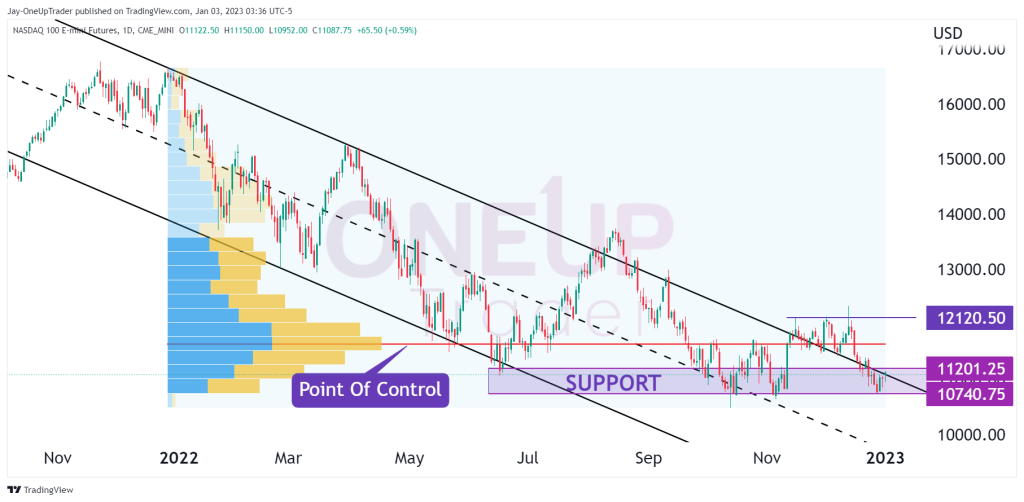
Trend Channel, Support Zone, & Volume Profile
There are three main points I want to focus on regarding the NQ chart.
Trend Channel – It continues to hold its form as the market follows it downward. The trend channel is the main bearish technical indicator right now. A break above 12120.50 would tell us the channel is no longer valid.
Support Zone – The support between $10,740.75 & $11,201.25 is the main stronghold for bulls at the moment. We can expect a lot more buy orders around these levels than usual. A break below this support would trigger sell stops and potentially send NQ downward.
Volume Profile – Calculating the volume profile for the year 2022 gives us an interesting development in the form of the point of control line. The point of control (POC) line is a horizontal line on a volume profile chart representing the price level at which the most trading activity occurred during a given time. This will likely be a big hurdle for any bulls to get past.