


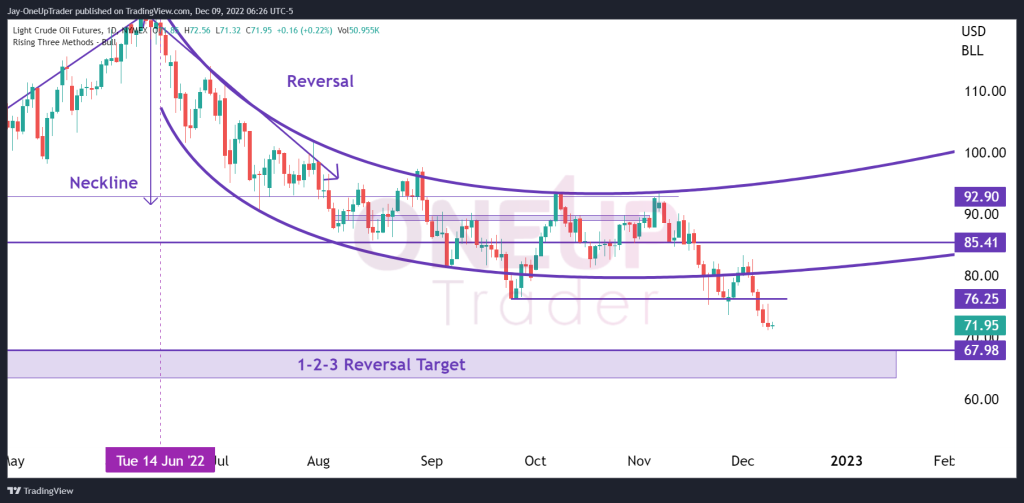
- Bears take over as CL’s price drops 12% in a week.
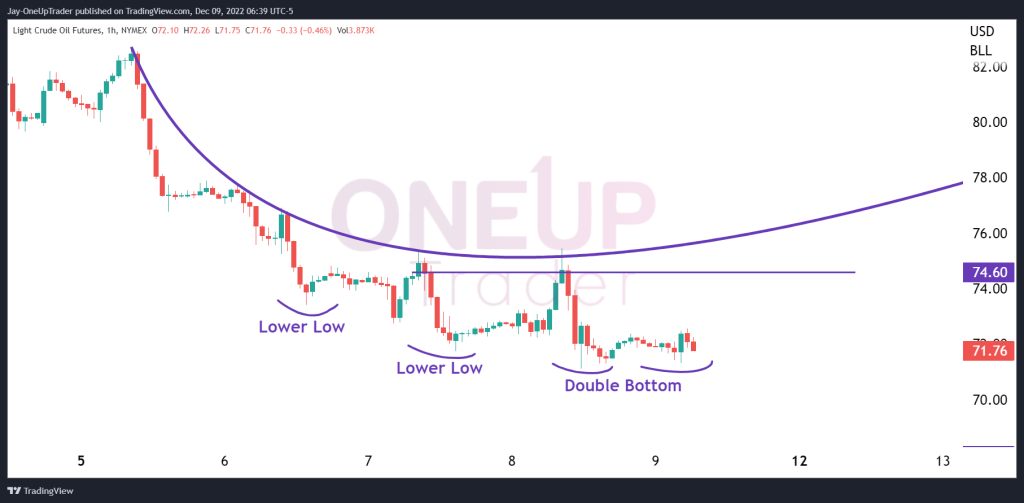
- The hourly chart shows the potential of a double-bottom formation.
Bears Take Over
In Monday’s article, we discussed two possible scenarios, the Bear case and the Bull case. Since then, CL has dropped 12% and has taken out the spinning top’s low. CL is currently trading at $72, with the 1-2-3 reversal target at $67.98. It’s also the 5th daily red bar, and Thursday’s session is a hanging man that has not been confirmed just yet. This tells us that shorting now may not be the best option, and waiting for a relief rally may be the best option for the Bears.
Looking At The Trend On The Lower Timeframes
If we look at the hourly chart, the downtrend has made 3 lower lows in succession. A double bottom pattern has been formed, which may result in a short consolidation period or relief rally. This could extend into the start of next week. $74.60 is a potential area for the Bears to enter into short positions if they have missed the initial move down. At current prices, I don’t believe it’s a profitable trade to short at these prices as it would result in chasing the market lower, and that is a losing strategy.
Summary
The 1-2-3 Reversal is the bearish target at this point. Bears could wait for a retracement into the $74.60 level before initiating new shorts. The Federal Reserve meeting next week will play a massive role in the markets, and there is a sense that everyone is waiting for that before making their next play.