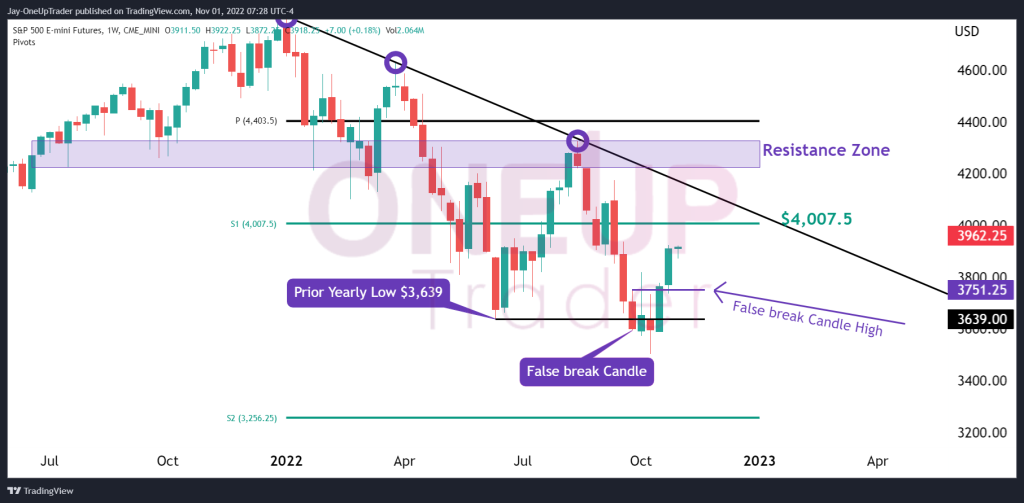
- The weekly chart shows a bullish false-break candlestick formation.
- Analyzing the support/resistance band on the 4-Hourly chart.
- A look into the 1-Hourly trend channel.
False Break Candle
The false break candle strategy is one we are familiar with at OneUp Trader, and for a good reason – its reliability!
The pattern works because when the price breaks below the low and is bought up quickly afterward, it tells us that the bulls are far stronger than the bears even when an area of support has been broken to the downside, which usually leads to a steep decline in price. Once the high of the false break candle has been broken to the upside, it’s a signal to begin taking longs. You can learn more about the false break candle strategy on our youtube channel here.
The false break candle formed on September 26th, and we saw the high of that candle taken out on October 17th’s trading week. The candle that followed was a solid bullish candle that pulled ES up by 3.9% that week.
The next target for Bulls is the Support 1 level on the pivot point indicator, which is at $4,007.5. There is a powerful trend line that has defined the downtrend from the start of the year. If ES rallies through the $4,007.5 level, then it’s possible to see the trend line tested, which may set up nicely for short trades. That line is 5% away from the time of writing.
4-Hourly Outlook
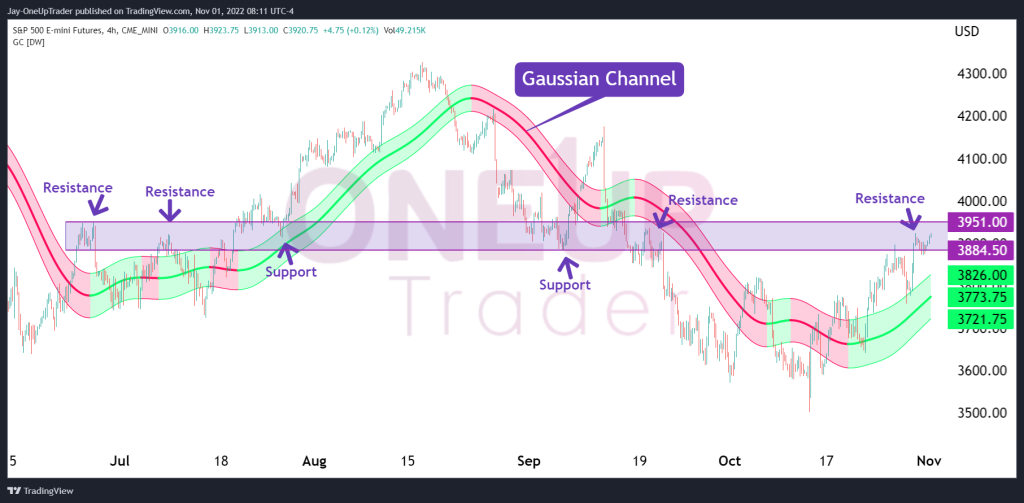
The 4 hourly chart has a support/resistance band dating back to June that has proven to be a strong turning point in the market. The band is between $3,884.50 and $3,951.00, and currently, ES is trading within that band.
The Gaussian channel has also turned green on the 4-hourly chart, which can be a great indicator to trend trade while the market retraces into the zone. Note that the Gaussian channel can only have reliability if a trend is present.
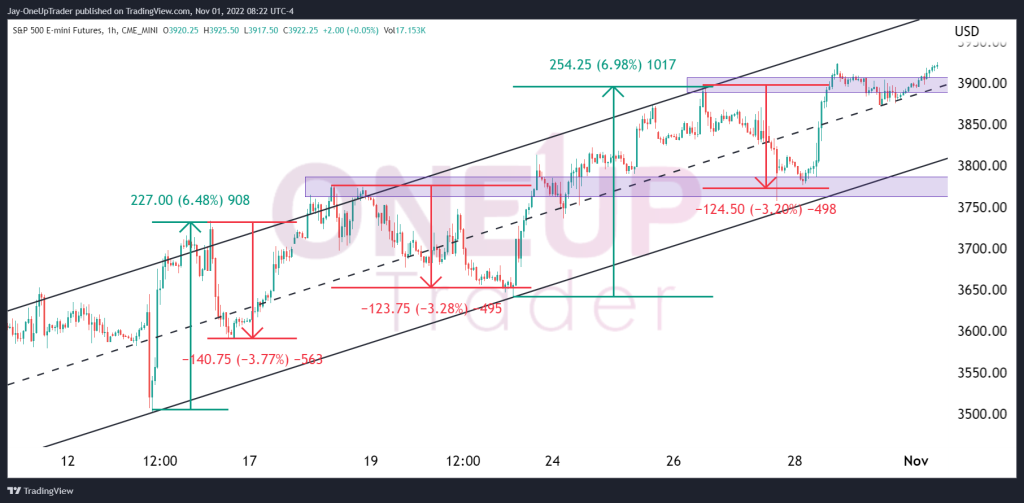
1-Hourly Trend Channel
I wanted to make a note for the traders trading the shorter-term time frames, such as the hourly chart, that there is a parallel channel in which ES has been trading within. The channel has had two significant rallies thus far, each being over 6% which printed us those large candles on the weekly. Each retracement has been around 3%, which is something to be mindful of.