

Like most markets around the world at the moment, US equities are on a tear, especially after the rate data yesterday. It is really difficult to find a bearish opportunity in this market, which points us in the direction of ‘the trend is your friend’.
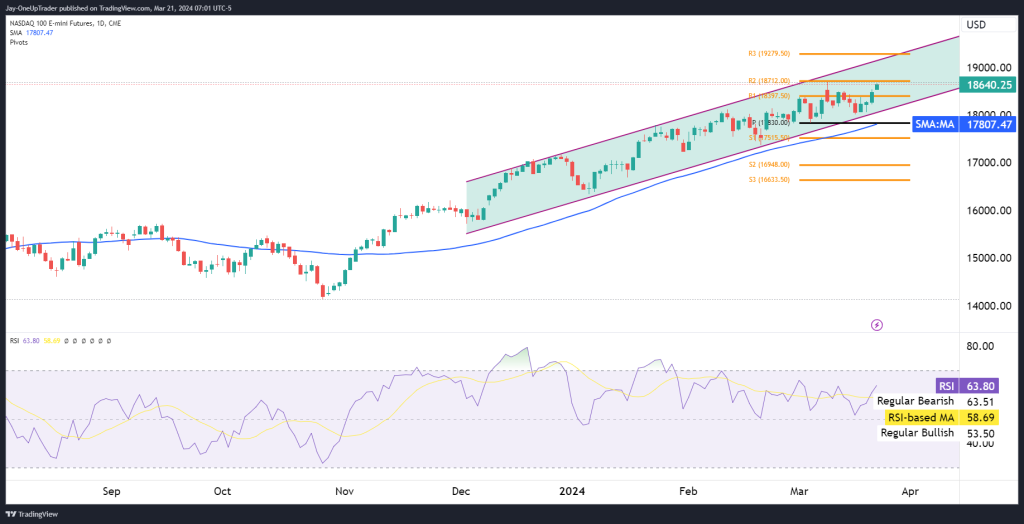
Daily Chart:
The market is trading within a rising channel, showing an uptrend with the price currently close to the channel’s resistance. The SMA indicates a strong trend, while RSI is moderately high, suggesting potential overbought conditions but not yet a concern.
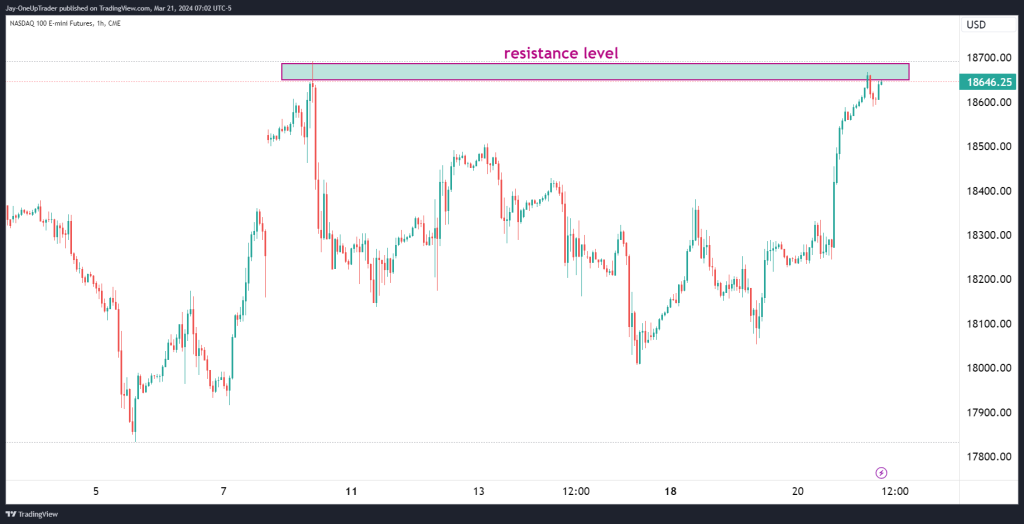
Hourly Chart:
A clear resistance level is visible, with price action showing hesitation. This could indicate either a potential breakout or reversal.
Trade Opportunities:
Given the resistance, traders could look for a confirmed breakout above the resistance level for a long position, targeting the next resistance at R1 (19397.50).
Rating:
The overall rating is cautiously bullish only because the market has rallied so hard for the past few months. The market is trending upwards, but the proximity to the channel’s upper boundary and the resistance level calls for careful trade entry and exit strategies. Continuation of the trend is likely, but a temporary pullback or consolidation could occur before further upward movements. The bullish stance holds as long as the price remains within the rising channel.

