


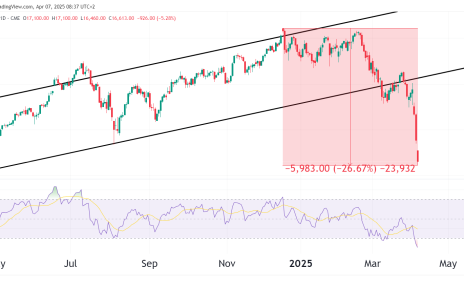
- A Parabolic channel has been identified on the Daily Chart.
- CL is trading off a support zone at $81.40.
- Important note on stop placement.
Chart Analysis Recap
The Head & Shoulders pattern referenced in our CL chart analysis on November 7 did not confirm. The neckline acted as a barricade that the bulls could not push through. As a result, the price of CL has fallen from around $93 to $81.80 at the time of writing.
Daily Chart Analysis
Support zone
There is a support zone that CL is currently trading within at $81.40. A bounce out of this could lead to a swift move up to $87.46, which is the 0.236 Fibonacci level. It may be a good idea for bulls to use a smaller time frame to look for a reversal signal within this zone so as not to miss the move if the bounce does occur. Waiting for confirmation on the Daily chart would likely result in the rally happening before an entry can be taken.
Parabolic Channel
CL has found resistance off the upper parabolic curve line five times. As long as we see price remain within the channel, we can look to keep targets and entries within the zone. If the support level does not hold and we see a break below $81.40, then a move toward the yearly lows of $76.24 could be on the cards. That is also around the lower line of the parabolic curve, which could mean an increase in buying pressure.

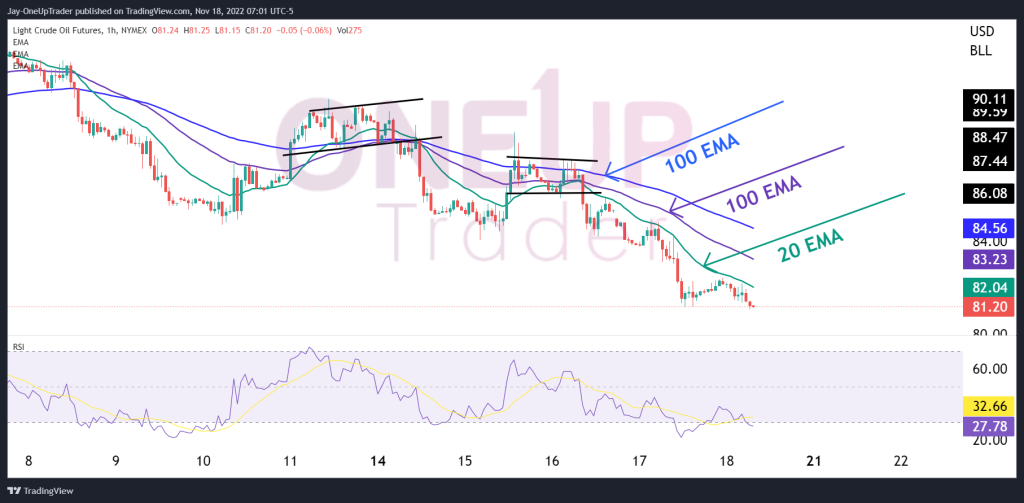
Hourly Chart Analysis
I applied a 20 EMA, 50 EMA, and 100 EMA on the hourly chart. Each time the price retraced into the 100 EMA, we see a consolidation generally lasting the length of one session. The RSI is currently oversold, printing a value below 30. This is a good sign for bears as it shows the downtrend is still strong; however, it may be ideal to wait until the price retraces into the 100 EMA. A more aggressive approach will be initiate a short position now if one believes the analysis done on the Daily chart is enough. A wide stop would most likely be required for that type of trade.
Risk Management & Stop Placement
It’s important to remember that all traders must develop their own unique style. Most online educational content always advocates having a risk-reward ratio of 1:3 or more, but this may not be essential. Traders can be profitable each week trading with a 1:1 risk-reward ratio depending on their trading style.
How often have you been correct on the price direction, but your stop loss was hit before the move began? It’s a sign you are choking your trades and should consider widening the stop. You can always drag it closer once the position moves with you.
Trading this way allows you to be very selective on your trades because if you are initially going for a 1:1 risk reward, you psychologically know that the position you take must be of high quality. This also means that you will be trading less from hope and emotion and more from a rational standpoint.