- ES is up 18% for the year but is approaching resistance before all-time highs.
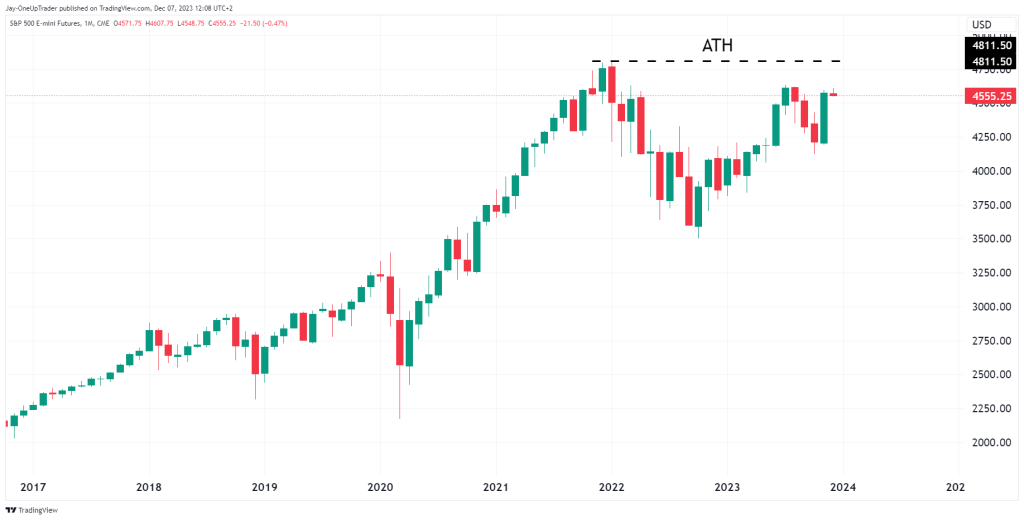
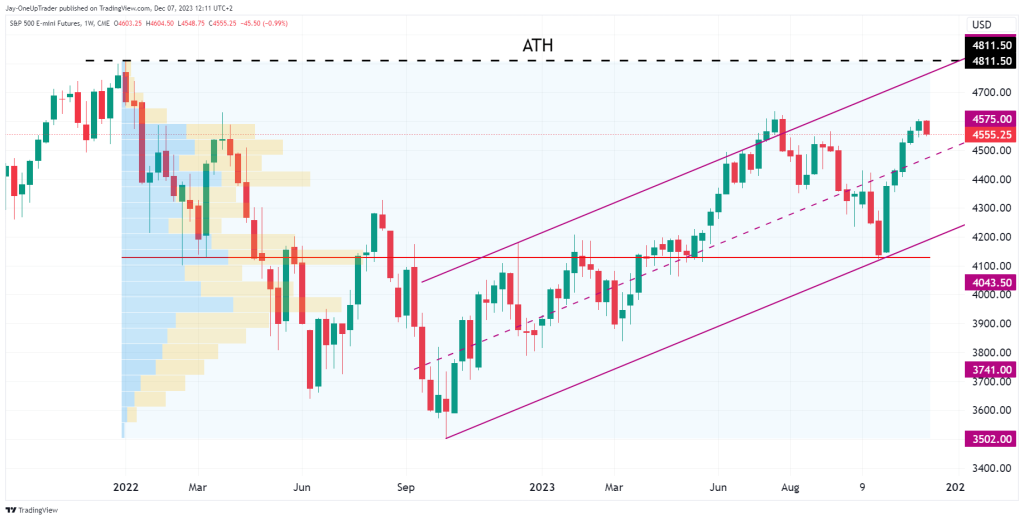
- The weekly chart and monthly chart show bullish sentiment remains strong.
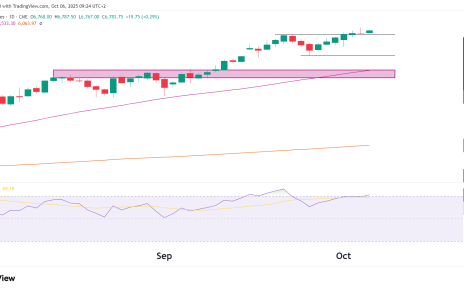
- The daily chart shows possible short entries for bears and levels to watch.
Introduction
The S&P 500 is close to ending the year well in the green, currently at an 18.5% return for the year. 7 months have closed in the green, and we will need to wait and see what December brings, but after this rally, it wouldn’t be surprising to see some investors who were long, liquidate and take some profits or funds settle their books. Let’s look at all the major time frames and see what the best course of action is to take as we close in on the end of 2023.
Monthly Chart
The monthly chart shows no real significant pattern, continuation, or reversal. At the moment, we see that all-time highs are very close to being tested, and as long as that level is passed with conviction, technically speaking, there will be no real worry for the bulls. There is always the possibility of a 1-2-3 reversal around this level, and that would send ES tumbling, but with what is happening with the FED, taking shorts would be betting against them, which could work but is risky. Short-term and medium-term traders don’t need to concern themselves with that outlook.
Weekly Chart
We have clear trend channel that has formed and can be easily seen on the weekly chart. Price is slightly overbought at current levels based on this trend channel, so bulls might see better entries if they demonstrate some patience. You can see in the chart below the clear POC for the volume profile is sitting at $4150, usually, the POC acts like a magnet for price. There is also a possibility of a double top forming here that we will look at on the daily chart.
Daily Chart
The double top that could form lines up with the red rectangle on the chart below, which is the resistance zone from July of this year. Bulls would probably be better off waiting it out at this point, and bears don’t have a possible entry based on yesterday’s bearish candle. Stops can be placed above the high of around $4612, but they must keep in mind that this could just be the start of a consolidation phase instead of a sell-off. It is also likely, based on the other two longer-term charts, that ES will not likely drop too far, support could step in around $4,400 and then $4,100 if prices retrace deeper.