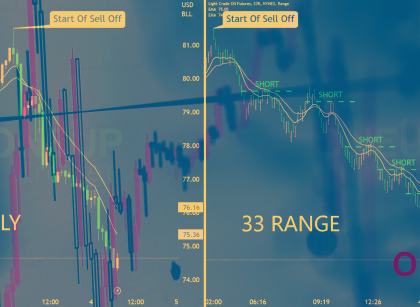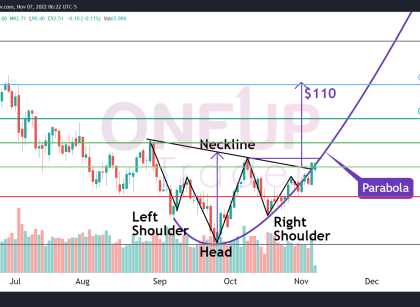

The parabolic curve on the CL chart continues to act as support. A Potential inverse Head & Shoulders formation on the 4-Hourly time frame. Point of control volume profile acting as resistance. Daily Chart Recap From last week’s multiple tests of the parabolic curve, CL is repeating the same tests once more, with the price Read More…