The daily trend is still bearish Price consolidating around the $1 level Range-bound trading opportunities on the 2-Hour Chart Introduction Because of the worse-than-expected CPI data and a strong Dollar, we can take advantage of many potentially good trades available in the markets currently. The fear of an economic crash in Europe is rising due Read More…

Technical Analysis
E-mini S&P 500 (ES): Technical Outlook
Signs of rolling over effect on the weekly chart Consumer Price Index (CPI) report is bearish for markets in general Bull case: Support band+point of control volume profile Weekly Chart Notice on the chart below how we see a rolling effect as prices retrace after a sharp move down. When we see these patterns form, Read More…
Technical Outlook: Gold Futures (GC)
Gold trading inside minor and major support zones Gold Sell off as Dollar rallies after CPI report Volatile market conditions expected The Daily Support Zone Last week we spoke about the major support zone in GC in this article. We still find a lot of buy support happening at this level even after a major Read More…
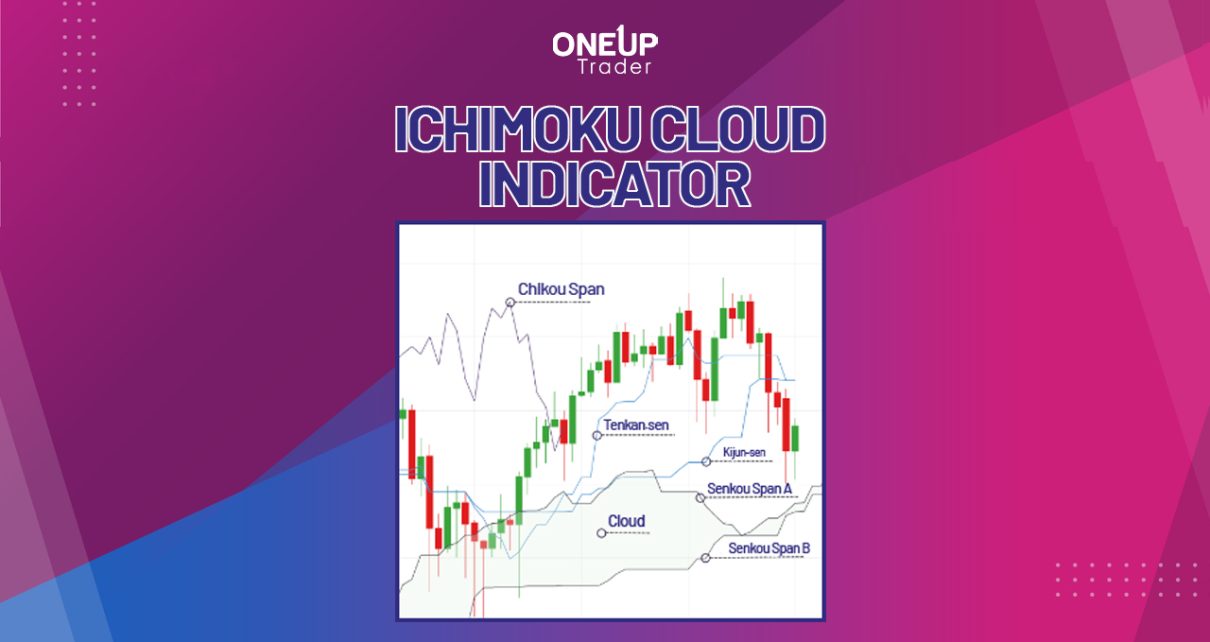
Ichimoku Cloud Indicator Trading Strategies
The Ichimoku cloud indicator, also called the Ichimoku Kinko Hyo, is arguably one of the most versatile technical indicators. At first glance, it may appear convoluted and probably hard to understand, especially due to the several components. However, its greatest advantage is that it combines backward and forward-moving averages to determine an asset’s trend, momentum, Read More…
Crude Oil Futures (CL) Reverses Bearish Course
Prices rally to trade within the consolidation zone Price potentially targeting the 50 Moving Average on daily time frame. Daily Trend The daily chart shows a steady downward trend since June with prices bouncing predictably within a channel as shown in our analysis below. The market could be targetting the 50 moving average where we Read More…
E-mini Nasdaq 100 Futures (NQ): Technical Analysis Recap
Prices rally through minor resistance 38% Fibonacci target level reached Bullish Engulfing Candle forms on the Weekly Chart Bullish Weekly Engulfing Candle Last week’s trade saw a bullish engulfing candle close on NQ after three consecutive weeks of red candles. The entire candle has traded below and above the previous week’s trading range and closed Read More…