

- Prices rally through minor resistance
- 38% Fibonacci target level reached
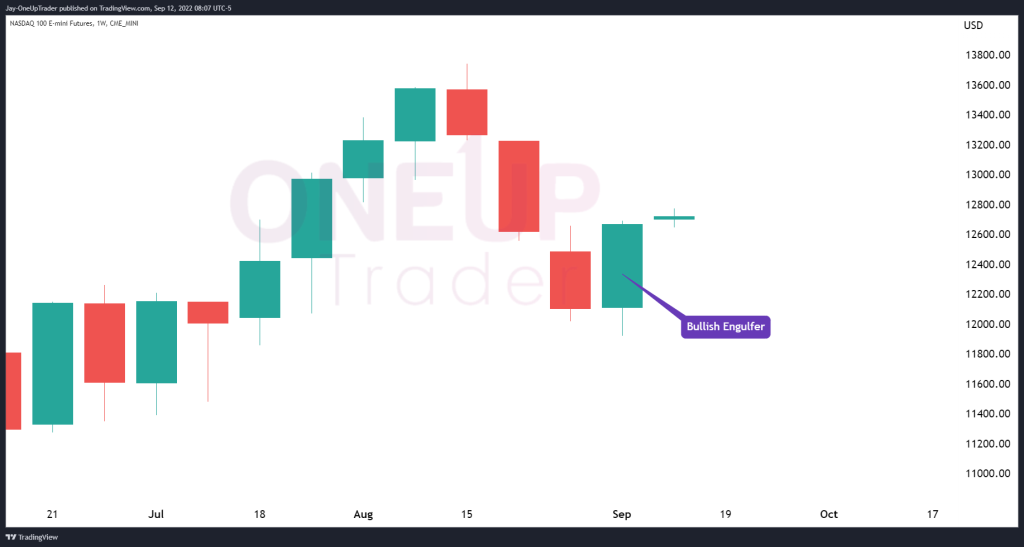
- Bullish Engulfing Candle forms on the Weekly Chart
Bullish Weekly Engulfing Candle
Last week’s trade saw a bullish engulfing candle close on NQ after three consecutive weeks of red candles. The entire candle has traded below and above the previous week’s trading range and closed just above the previous week’s high, indicating strong bullish momentum.
NQ Breaks Above Resistance
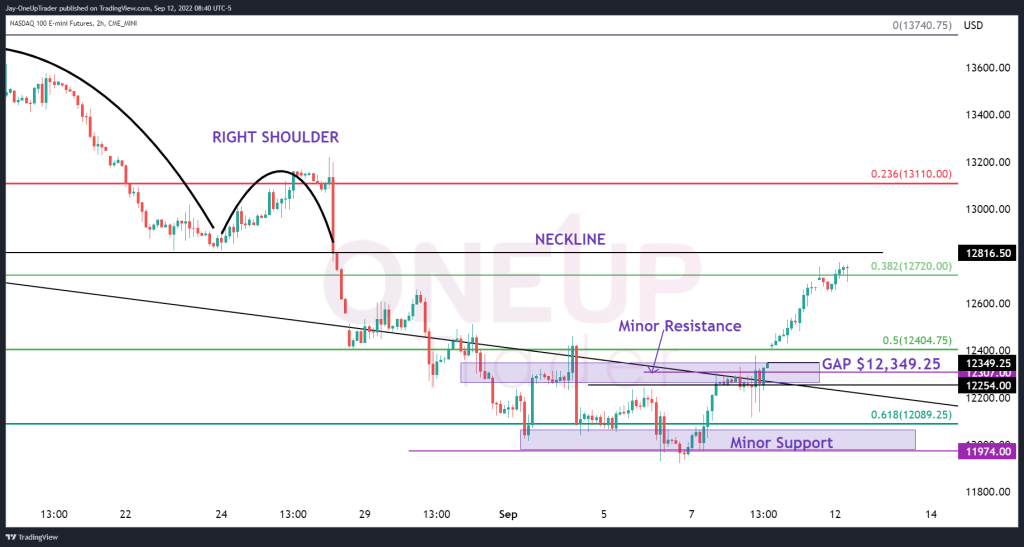
As we analyzed here, the bulls were looking for $12,720 as their target, and we see NQ has rallied up to that point, currently trading at $12,730. This also coincides with the Head and Shoulders Neckline, which generally acts as resistance once prices begin to trade back up and test it.
Bulls
Moving forward, there are key levels we need to be mindful of. The 38% Fib level and Neckline are still resistance levels that haven’t been broken yet, with enough momentum to confirm the trend will remain bullish.
If, however, we see a breakout through the neckline, the bulls may search for their next target of $13,110 which is the 23% Fib level and the top of the right Shoulder from our Head and Shoulders pattern.
Bears
Bears are losing at this point, but we know markets can change instantly. If the Neckline and the 38% Fib level maintain enough selling pressure and we begin to see prices fall, the bears may want to fill the Gap at $12,349.25, which could be the target. Short traders will need to be patient and wait to see if there is enough resistance at current levels.