- Minor support level broken
- Downtrend continuation with $11,592.75 as a target for Bears
- MACD slightly oversold in the short term
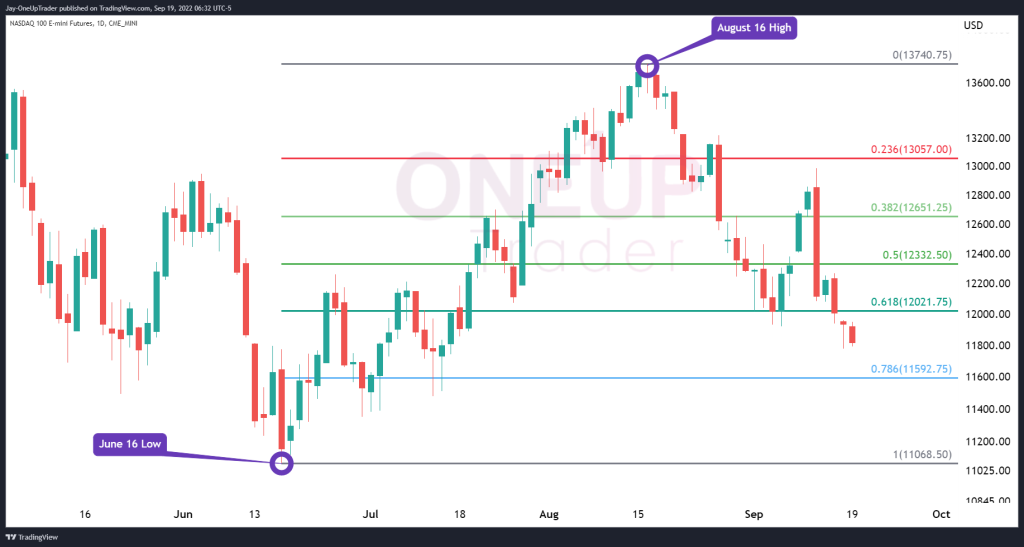
Fibonacci Retracement levels
On Monday, September 19, the trading session opened lower, and the Bears seem firmly in control now. Connecting the June 16 Low to the August 16 High with Fibonacci retracements gives the bears a target of $11,592.75.
Short Term Outlook
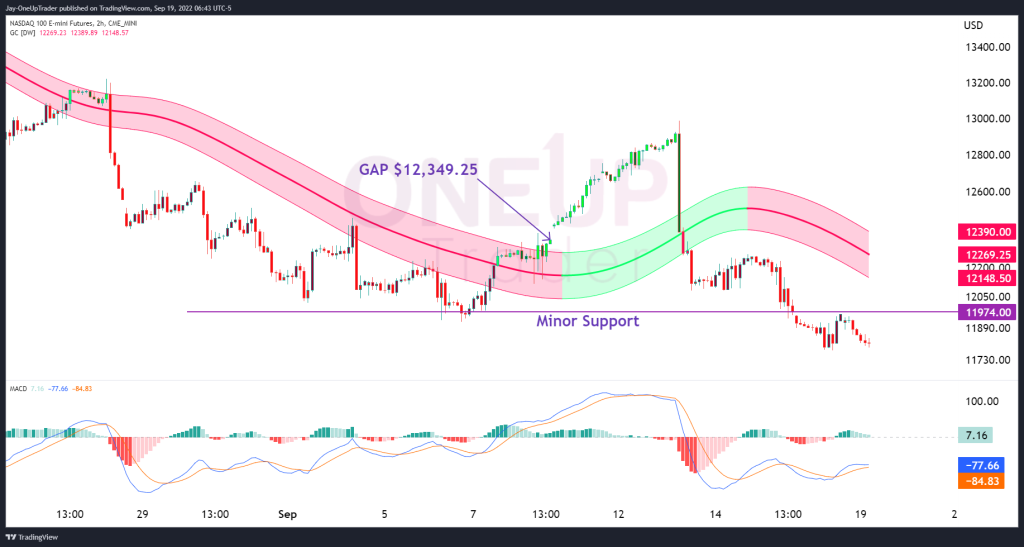
The minor support level at $11,974.00 has been broken to the downside, which gives additional strength to the bearish target on the daily chart mentioned above. The MACD, however, is oversold at the moment, so we do not think taking any shorts right now is the way to go. If the minor support level turns into resistance, we could wait for the formation of a few bearish candlesticks around there before initiating a short position.
The Gaussian Channel has also turned red on the 2-hour chart, and since the market has broken out of a consolidation period, we could also be looking to take shorts as price retraces back into the Gaussian Channel.
Summary
Market volatility remains high as markets continue to digest the CPI data released last week. NQ has been steadily printing lower prices. If bears remain in control, the $11,974.00 level is the target this week; for any Bullish scenarios, we need to see prices break above the Minor support at $11,974 before we can look at any long calls.