- A 5% swing was recorded in yesterday’s trading session
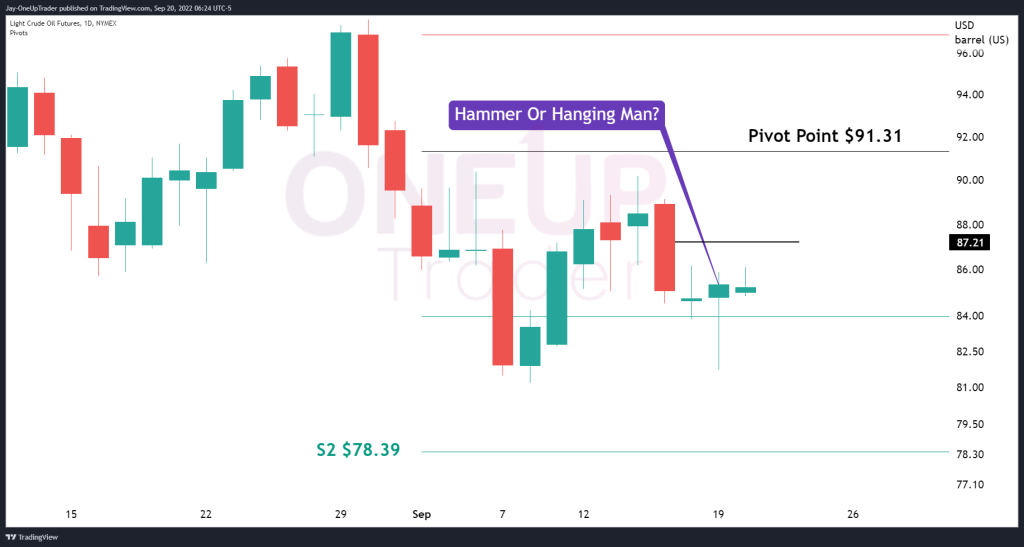
- Hammer or a Hanging Man Candlestick Pattern formation
- Crude oil’s downtrend still intact since the middle of June
- Targets for the bears and the bulls
Daily Chart Candlestick
Yesterday’s session saw a swing in CL from being down 4.3% to reversing and closing 0.6% in the green. This gave a very interesting candlestick pattern that hasn’t been confirmed yet. It can either be a bullish hammer or a bearish hanging man pattern.
Hammer
The hammer is an incredibly bullish pattern, but only if we see a confirmation with a strong green candle within a few days after the hammer is formed. This is why it’s important to emphasize that we cannot confirm nor deny the hammer is reliable yet. If the price of CL closes above $87.21 in the following days, we can say the pattern has been fully formed. From here, diving into a shorter time frame and looking for long opportunities until the pivot point at $91.31 can be a strong play.
Hanging Man
The hanging man candlestick pattern tells us that bulls have been strong enough to reverse the course of a falling market to close near the open for the day, as was the case in yesterday’s session. If there is not enough buying power, the subsequent few sessions will have a big red candle closing near the low of the hanging man, confirming Bears are in control. If this scenario plays out, it’s reasonable to look for targets of $78.39, which is our pivot S2.
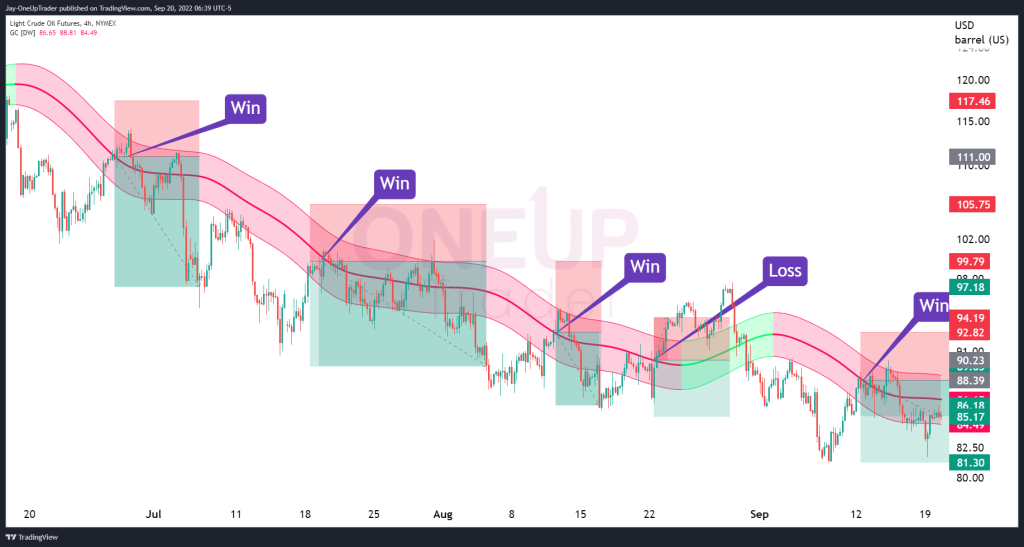
Trend on 4H Chart remains Bearish
The 4-hourly chart has shown how powerful it can be to trade with the trend, keeping in mind to buy low and sell high. Price retracements provide perfect opportunities to sell into buy pressure as the market falls.
The Gaussian Channel has proven to be profitable 4 out of 5 times by entering into a short position with a wide stop on the mid-Gaussian line. The upper Gaussian line is what we should be watching as it continues to find sellers around it.
Summary
The long-term trend remains Bearish, with the 4-hourly trend giving opportunities to sellers on pullbacks. We have targets for the bull and bear case depending on whether a hammer or hanging man candlestick pattern forms. EIA Inventory report tomorrow will shake things up.