

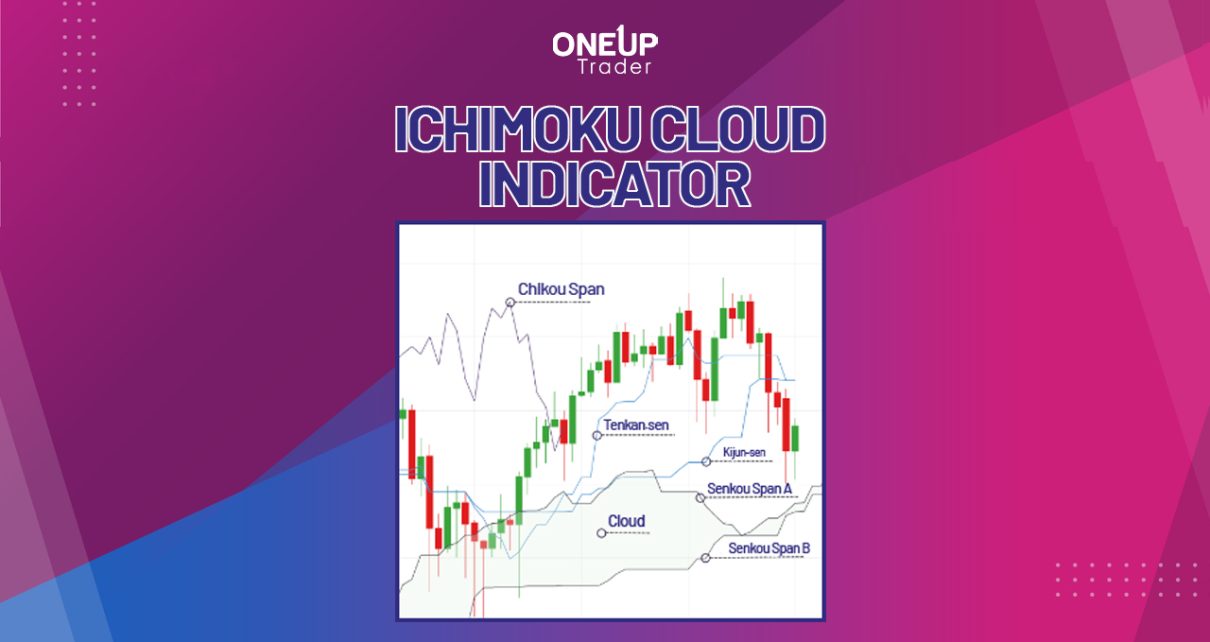
The Ichimoku cloud indicator, also called the Ichimoku Kinko Hyo, is arguably one of the most versatile technical indicators. At first glance, it may appear convoluted and probably hard to understand, especially due to the several components. However, its greatest advantage is that it combines backward and forward-moving averages to determine an asset’s trend, momentum, support, and resistance. Here’s a quick guide on how to use the Ichimoku cloud indicator to trade.
What is the Ichimoku Cloud Indicator?
Ichimoku cloud is a technical indicator that shows an asset’s price support and resistance levels, as well as its trend and momentum. It does this by plotting multiple averages on a chart, while the cloud itself is the difference between two moving averages.
Components of the Ichimoku Cloud Indicator
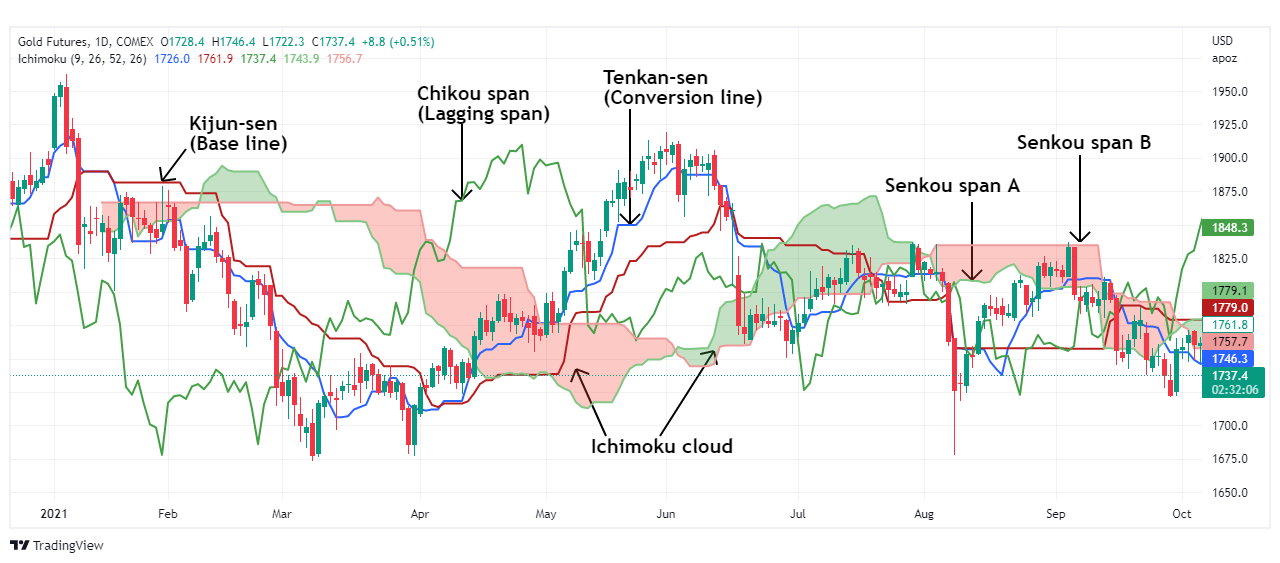
The Ichimoku cloud indicator comprises five components – the Tenkan-Sen, Kijun-Sen, Senkou span A, Senkou span B, and the Chikou span. Generally, these components use different period MAs and the average of the Mas’ highs and lows to plot the asset’s support, resistance, trend, and momentum.
Since the Ichimoku cloud indicator can be a bit messy, especially for beginner traders, it’s advisable to customize the color of the different components to avoid confusion.
Tenkan-Sen (Conversion Line)
The Tenkan-Sen is also called the conversion line – it’s the faster-moving average. It corresponds to the average point (highest + lower)/2 over 9 periods. Since the Tenkan-Sen doesn’t account for the closing prices, it closely mirrors the overall market volatility. This makes it ideal for spotting changes in momentum in an established trend, i.e., trend reversals. Typically, an upward-sloping Tenkan-Sen corresponds to a bullish trend, while a downward-sloping indicates a bearish trend. The magnitude of the trend can easily be determined based on the steepness of its slope.
Tenkan-Sen = (Highest price level over 9 periods + Lowest price level over 9 periods) / 2.
Note that the Tenkan-Sen serves as dynamic support in the uptrend or as resistance in the downtrend. It is the blue line on the Ichimoku cloud indicator.
Kijun-Sen (Base Line)
Kijun-Sen is also called the Base Line – the slower moving average. It is similar to the Tenkan-Sen¸ but only on a longer timeframe, usually 26-period MA. It corresponds to the average point over 26 periods and could serve as a “confirmation line” for the Tenkan-Sen. Since it filters the market noise, it can be used for more realistic support and resistance levels.
Kijun-Sen = (Highest price level over 26 periods + Lowest price level over 26 periods) / 2.
Kijun-Sen is the red line on the Ichimoku cloud indicator.
Senkou Span A (Leading Span A)
Senkou span A is the average point between the Kijun-Sen, and the Tenkan-Sen projected 26 periods in the future. This is the first line composing the Ichimoku cloud. It specifically captures the values of the Tenkan and the Kijun and projects them for 26 periods in the future, which means it represents the market’s current volatility.
Senkou Span A (SSA) = (Tenkan-Sen + Kijun-Sen) / 2 materialized 26 periods in the future
By default, the Senkou span A line is light green.
Senkou Span B (Leading Span B)
Senkou Span B corresponds to the average point over 52 periods (equivalent to 2 Kijun) projected for 26 periods in the future. This line fluctuates less, and given the number of periods taken into account, it will often be long and flat. Therefore, it will always be a strong support and resistance level.
Senkou Span B (SSB) = (Highest price level over 52 periods + Lowest price level over 52 periods) / 2
By default, the Senkou span B line is light red. Note that the space between the SSA and the SSB forms the cloud – the equilibrium zone of the market.
Chikou Span (Lagging Span)
The Chikou span is also called the Lagging Span, and it represents the closing of current prices moved 26 periods in the past. It is usually regarded as the “memory of the market” and makes it possible to validate the movement of prices. The trend is bullish when the Chikou span crosses the price from the bottom, and when it drops below the current price, it’s a sell signal. Note that the Chikou span is the green line on the Ichimoku cloud indicator
The Ichimoku Cloud
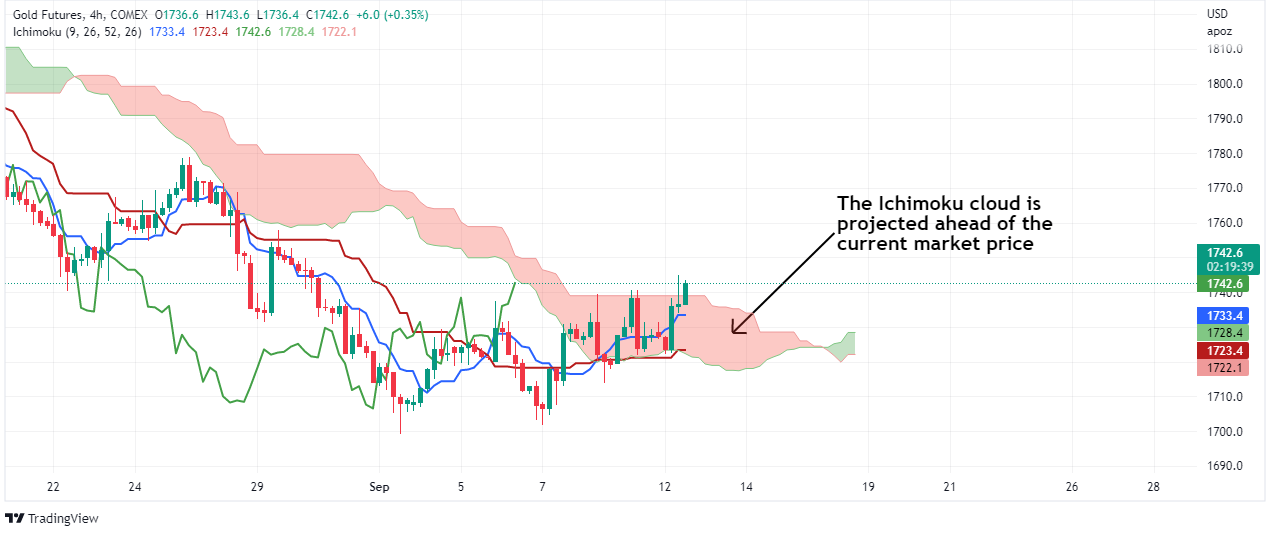
One of the most striking aspects of the cloud is the projection of the trend into the future because it shows the trader how the trend is doing. Normally, the Senkou span A and B run relatively parallel during an intact trend. However, they approach each other and eventually cross if a trend change is imminent. This intersection initially means at least a weakening of the trend, while a subsequent expansion shows that the new trend is getting stronger.
Generally, the Senkou span A and B readily establish the support and resistance regions at the edge of the cloud. Since the Ichimoku Cloud indicator provides price prediction, the cloud edges additionally provide an overview of the current and future support and resistance levels.
The chart below shows what the cloud looks like. Notice how the cloud is ahead of the current price – projecting the likely future trend. Remember this as we discuss how to trade using the Ichimoku cloud indicator.
How to Use the Ichimoku Cloud Indicator
As we’ve pointed out, the Ichimoku cloud (Kumo) is the region between Senkou Span A and Senkou Span B. You must first identify the trend and determine its strength to get accurate entry points from the Ichimoku cloud indicator. The cloud provides the trend direction and indicates support and resistance levels.
Generally, the current trend depends on the position of the price action in relation to the Ichimoku cloud. The trend is bullish when the price is above the cloud and bearish when the price is below the cloud. But when the price is trapped within the cloud, the market is trending sideways – with no dominant trend.
Once you’ve identified the trend, the next step is determining its strength. This is where the color of the cloud comes in. The cloud changes from green to red based on the position of the Senkou spans and indicates the prevailing trend. When the Senkou span A crosses above the Senkou span B, the Ichimoku cloud turns green; and red when the SSA drops below SSB. Note that the magnitude of the trend is determined by the position of the Senkou span A and Senkou span B. The bullish trend is stronger when A crosses above B, while the bearish trend is stronger when the Senkou span B crosses above the Senkou span A.
With these conditions in mind, the entry signal is generated upon the crossover between the Tenkan-Sen and the Kijun-Sen. Note that you can always adjust the period used in the indicator to fit your trading style.
Bullish Ichimoku Signal
These are conditions for a bullish signal when using the Ichimoku cloud indicator:
- The Ichimoku cloud should be green – in this case; the Senkou span A is above the Senkou span B
- Tenkan-Sen crosses above the Kijun-Sen
- The Chikou span is above both the current price action and the cloud
- The Ichimoku cloud is rising steeply
- The Chikou span is sloping upwards and crosses above the price action, and the cloud
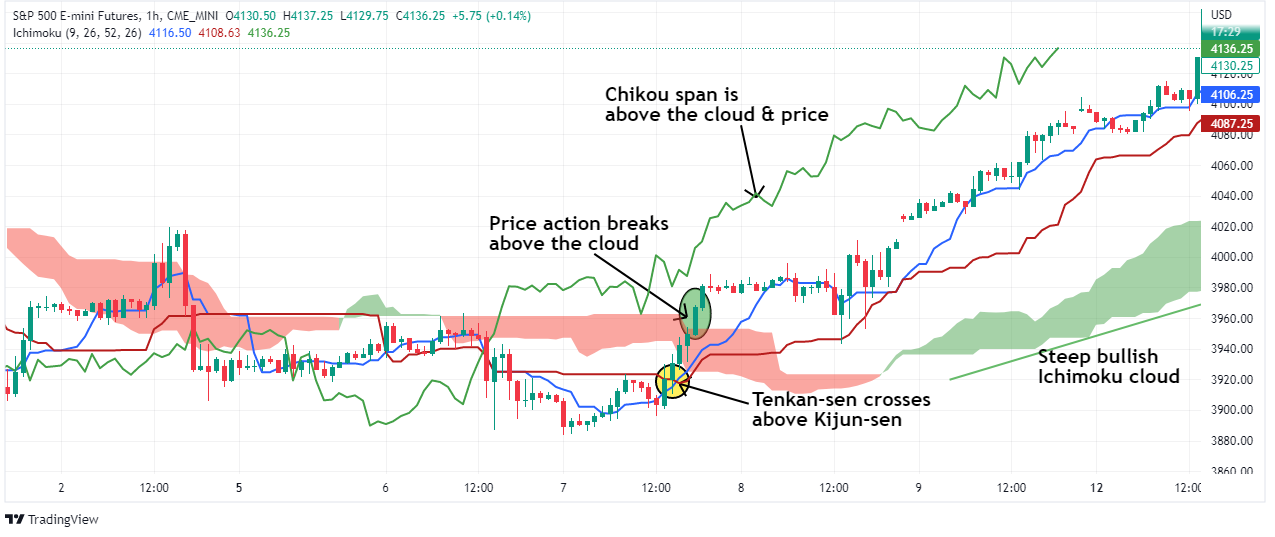
With all these conditions met, a buy signal is generated when the price breaks above the cloud. Using the average true range indicator, you can set your profit target based on the prevailing market volatility. The stop loss target should be directly below the cloud.

Bearish Ichimoku Signal
These are conditions for a bearish signal when using the Ichimoku cloud indicator:
- The Ichimoku cloud should be red – the Senkou span A is below the Senkou span B
- The Tenkan-Sen crosses below the Kijun-Sen
- The Chikou span is below both the current price action and the cloud
- The Ichimoku cloud is slanting downwards
- The Chikou span is sloping downwards and drops below the price action, and the cloud
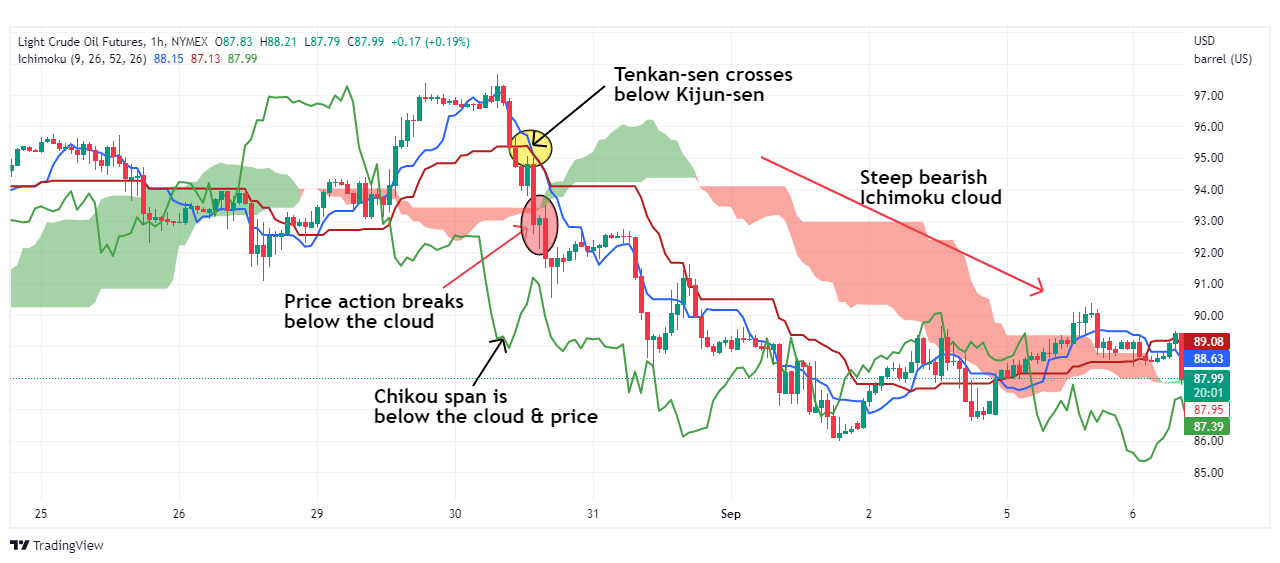
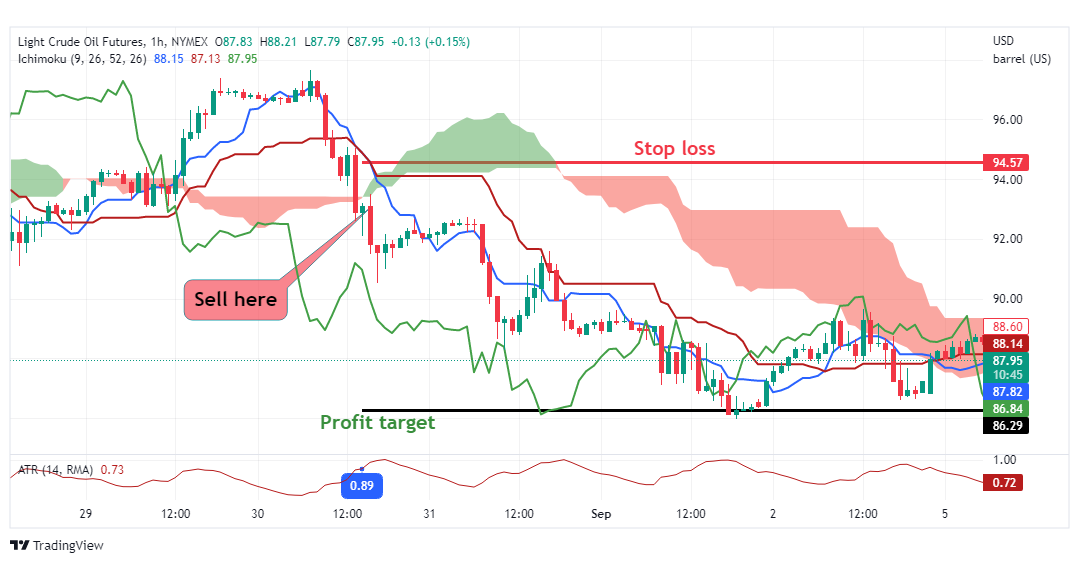
With all these conditions met, a sell signal is generated when the price breaks below the cloud. You can set your profit target depending on the prevailing market volatility, as measured by the ATR indicator. And the stop loss should be immediately above the cloud.
The Bottom Line
Just to recap, here’s the Ichimoku cloud cheat sheet. The indicator shows a bullish trend when the prices are above the green cloud. Conversely, the trend is bearish when the prices drop below the red cloud, while the market is in a ranging trend when price action is confined within the cloud. The indicator generates a buy signal when the price crosses above the cloud, after the Tenkan-Sen (the conversion line) crosses above the Kijun-Sen (the baseline). And finally, the sell signal occurs when the price action drops below the Ichimoku cloud after the Tenkan-Sen crosses below the Kijun-Sen.
For more insights into trading charts and indicators, browse our range of trading strategy articles on the One-Up Trader blog.
