


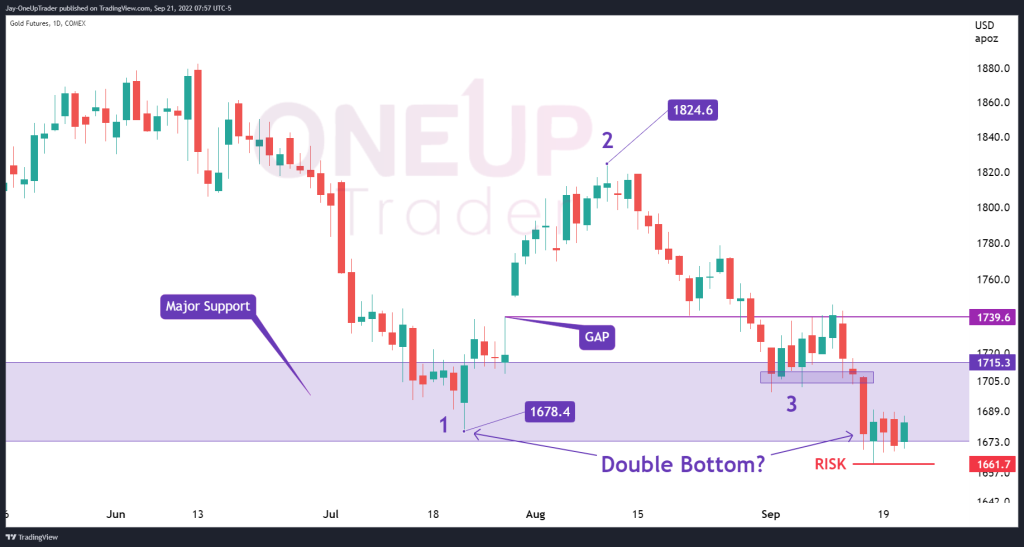
- 1-2-3 Reversal call turns into a potential double bottom
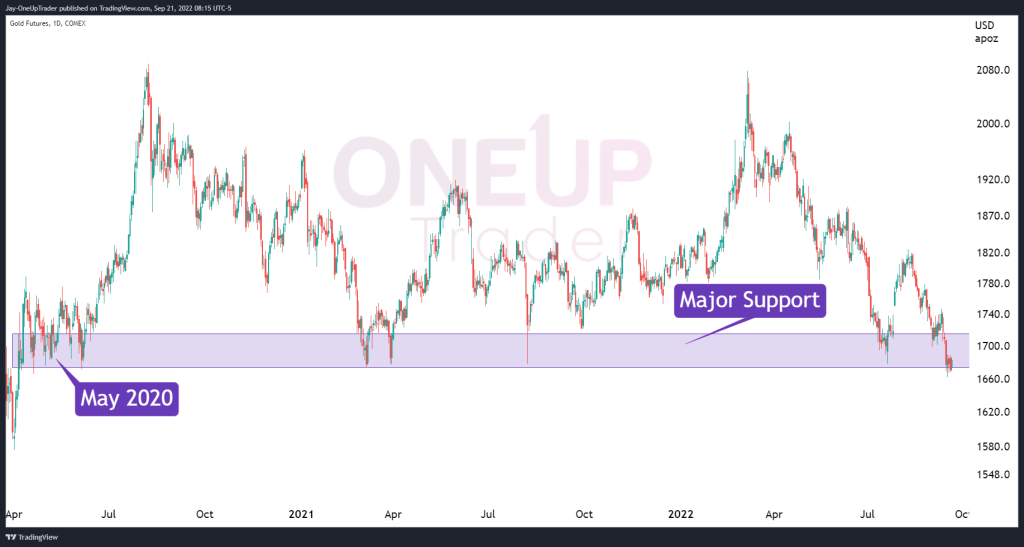
- Major support zone holding since May 2020
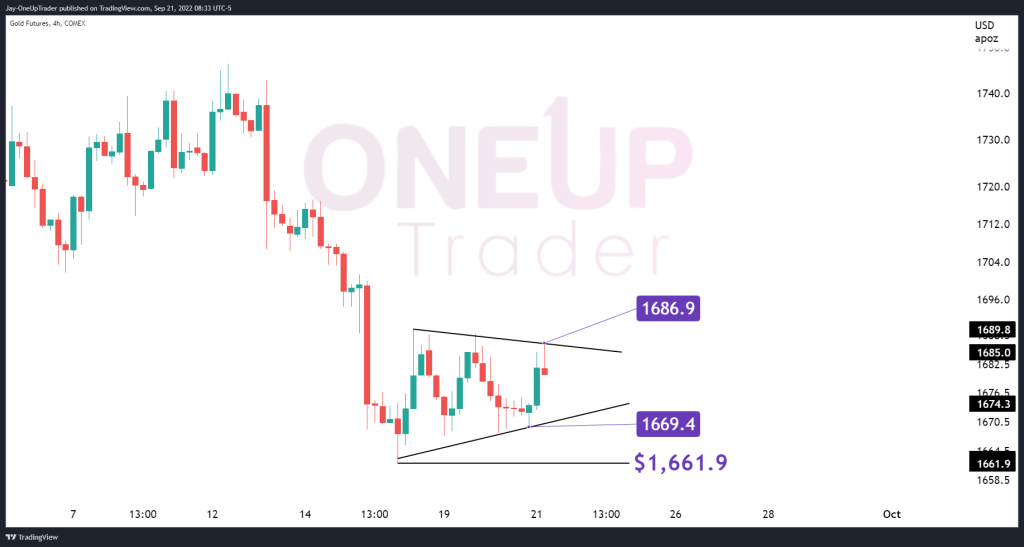
- Pennant chart pattern forming on 4 Hour chart
Support Zone Reminder
We need to go back to May 2020 to observe the major support zone, which has been tested six times in two years. The yellow metal is currently trading in the lower quadrant of the zone.
There are two possible technical scenarios.
Scenario 1:
If the dollar weakens, we could expect buyers to step in and push the price of Gold up and out of the zone giving legs to a move higher. The probability of this occurring appears higher than the opposite outcome. It also offers Bulls a well-defined risk and stops placement, as we will discuss later in this article.
Scenario 2:
If the dollar continues to strengthen rapidly as a result of the Fed aggressively raising rates, we could expect Gold prices to trade below the multi-year support zone. The Bears may step in, forcing the Bulls to liquidate their positions as Gold falls, looking for price stability below $1,660.
Double Bottom Pattern
We saw the potential for a 1-2-3 reversal pattern emerging two weeks ago, which we covered here. This has now turned into a probability for a double bottom formation on the Daily chart. The support zone mentioned above remains strong, giving a powerful narrative to bulls who wish to buy around these levels.
Risk is defined as well, with stop losses being placed below the recent low at $1,661.7. This Double bottom has still not been confirmed, though, if we see prices above $1,715.3, we could say the low is in, for now.
The Pennant
The 4 hourly chart is an excellent intermediatory between longer and shorter time frames. There is a pennant formed within $1,686.9 and $1,669.4. The foundation of the pattern is that it acts as a spring coiling up to eventually break out with force. We have noticed that pennants can break out in either direction, however, if it breaks out with the trend that occurred before the pennant formed, the pattern is tenfold stronger.
Keep in mind that if Gold breaks below $1,661.9, that is the low of the multi-year support zone and will likely result in tremendous volatility in the short term.
