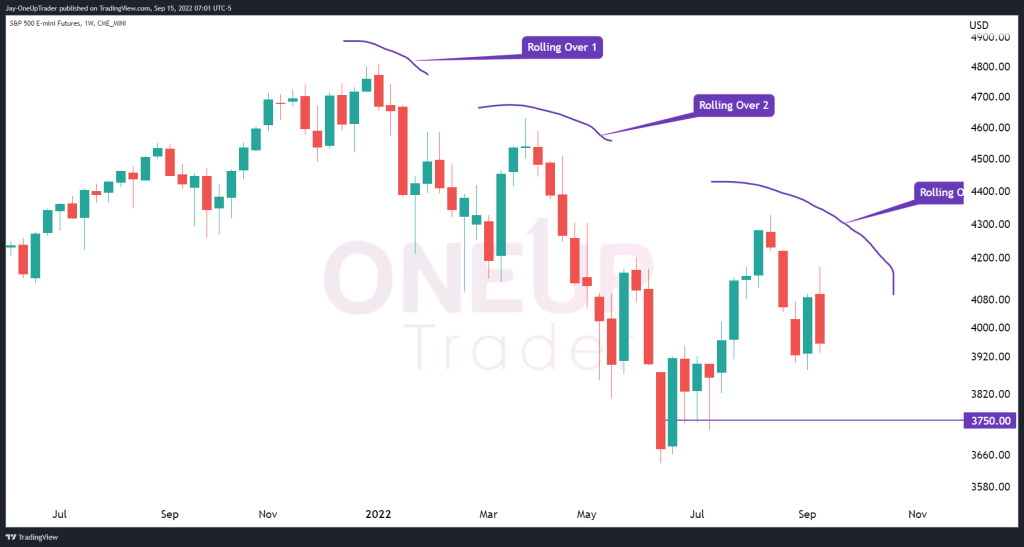
- Signs of rolling over effect on the weekly chart
- Consumer Price Index (CPI) report is bearish for markets in general
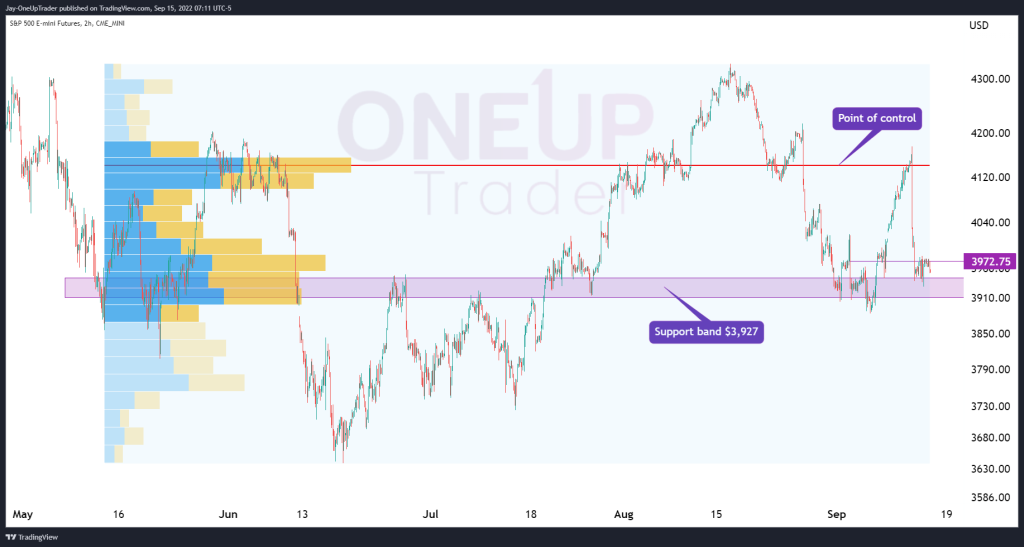
- Bull case: Support band+point of control volume profile
Weekly Chart
Notice on the chart below how we see a rolling effect as prices retrace after a sharp move down. When we see these patterns form, it usually starts gradually and then begin to accelerate; the first two rolling patterns did exactly that.
If this pattern continues with its momentum, we can look at targets of $3,750, which is near this year’s low, and then $3,520 if the low is eventually broken. However, this is a long-term view and may only begin to play out in the next few weeks/months.
CPI Report Causing Big Sell Off
ES dropped nearly 6% in a few hours as the CPI report created panic in the markets. Even though we have a technical bias, we cannot overlook the fundamentals, especially when they are as significant. If the Fed continues to raise rates aggressively, as expected after the CPI data release, it adds tremendous strength to the Bear case, and the low ‘may not be in yet.’ As traders always say, ‘don’t fight the Fed.’ This further solidifies the bears’ targets mentioned above.
Is There A Bull Case?
There could be some potential bull case with the current price action even. Looking at the volume profile indicator, we see the point of control line had been reached just before the sell-off after CPI. If buyers decided to step in, this would be the first target, but the support zone below would need to be held.
The support band at $3,927 is significant as it has been tested multiple times, switching between support and resistance. Prices are currently trading just above the support band and if they are not able to hold, we can expect the market to decline to the targets mentioned above. If the level holds, our first target is the volume profile line as discussed above.