

Introduction
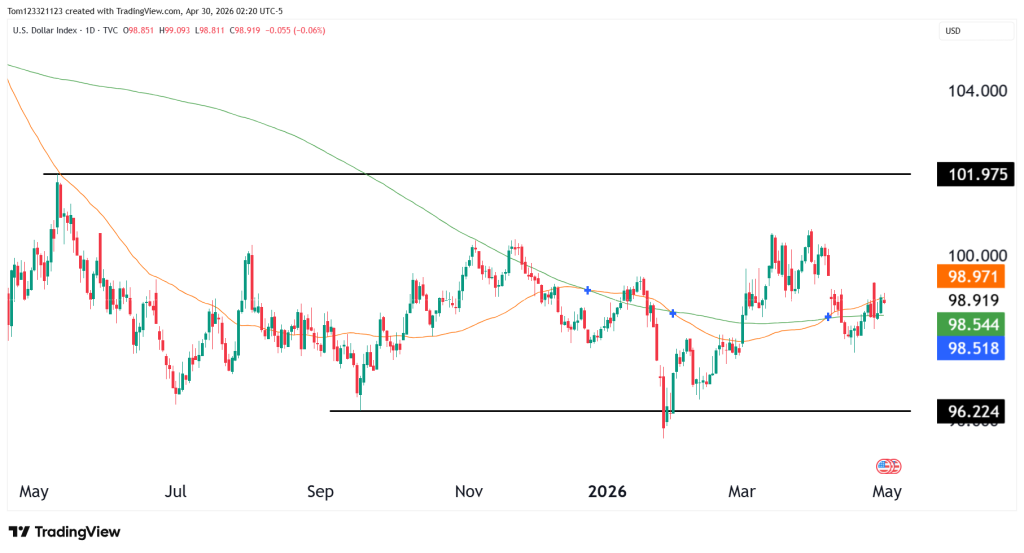
For the past few weeks, DXY has been trading within a clear range between roughly 96.20 and 102.00. That structure is still intact. Nothing on this chart suggests a confirmed trend change. The rally we saw from the lows at the beginning of the year to 102 was driven by escalation in the Middle East, and now that the market overall has had time to digest that, we are seeing price stabilize.
Even though DXY is not a tradable instrument, it is important to look at because it plays an important role in the price action of US equities, metals, and oil.
If the Dollar is getting stronger, we can expect it to be more difficult for equities to rally and vice versa, so let’s take a look at the technicals and what we can learn from them.
Price Behavior
After bouncing from the 96 area, the dollar moved higher steadily, without large spikes or sharp reversals. More recently, it has started to consolidate around the mid-range.
We can see that price is now interacting with both the 50-day and 200-day moving averages, which are flattening out so the market is not trending in either direction.
We also need to remember that for the DXY to get a strong trend in either direction is a big ask because it is priced against a basket of currencies. The Dollar needs to seriously weaken or seriously strengthen for us to see that. This is why we saw such a strong rally at the start of the year, because a geopolitical event caused it. The market is going to wait now for inflation data and FOMC coming out this Friday for better insight.
Key Levels That Matter
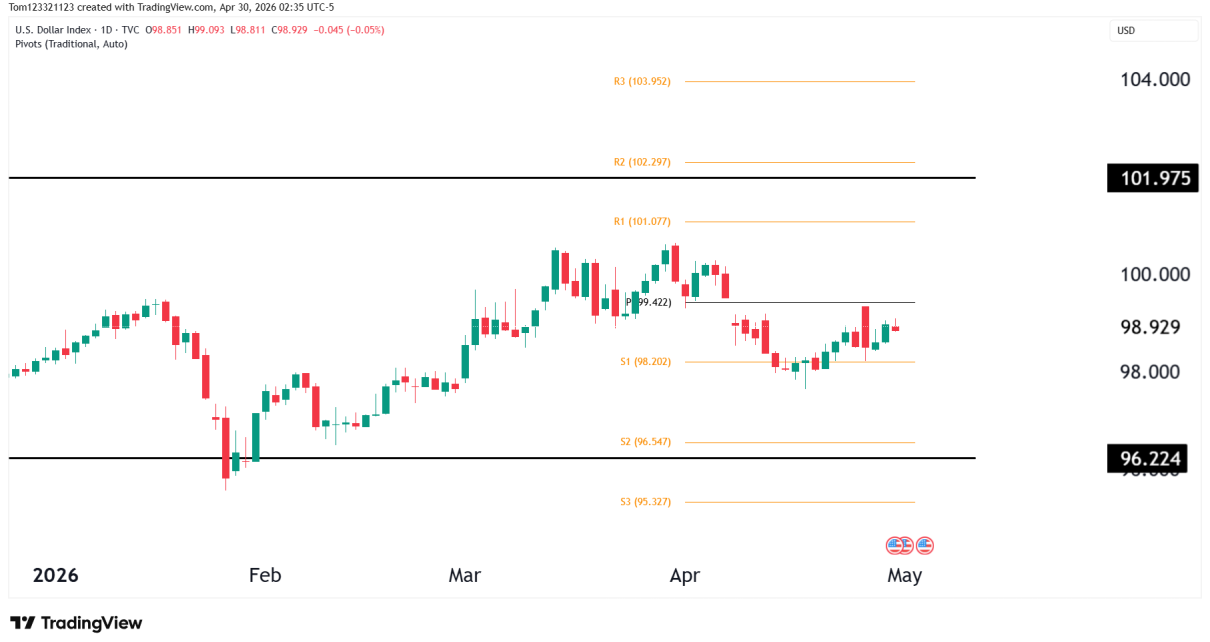
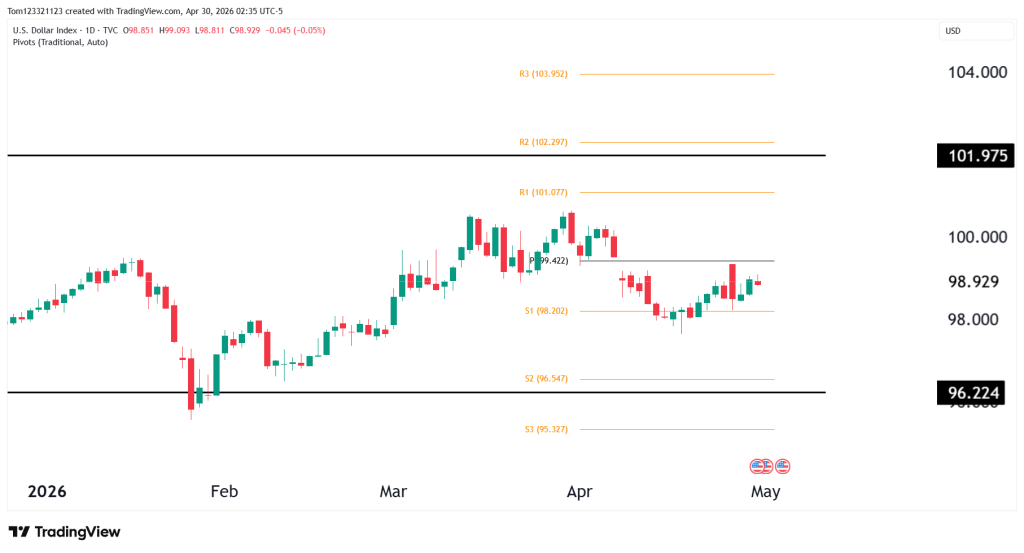
- Support: 96.20–96.50
- Mid-range: 98.50–99.00
- Resistance: 101.50–102.00
Right now, the focus is on whether DXY can sit above the 99 level. If price can hold above that area, it opens the door for a move toward 101–102, which has been the top of the range.
If it fails here and starts drifting lower again, then the range remains intact, and the lower bound near 96 comes back into play.
Scenarios and Probabilities
| Scenario | Description | Estimated Probability |
|---|---|---|
| Range | Continued movement between ~96 and ~102 | 45% |
| Bounce Higher | Hold above 99 → move toward 101+ | 30% |
| Breakdown | Failure → move back toward 96 | 25% |
