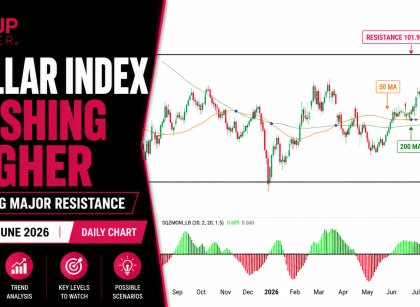
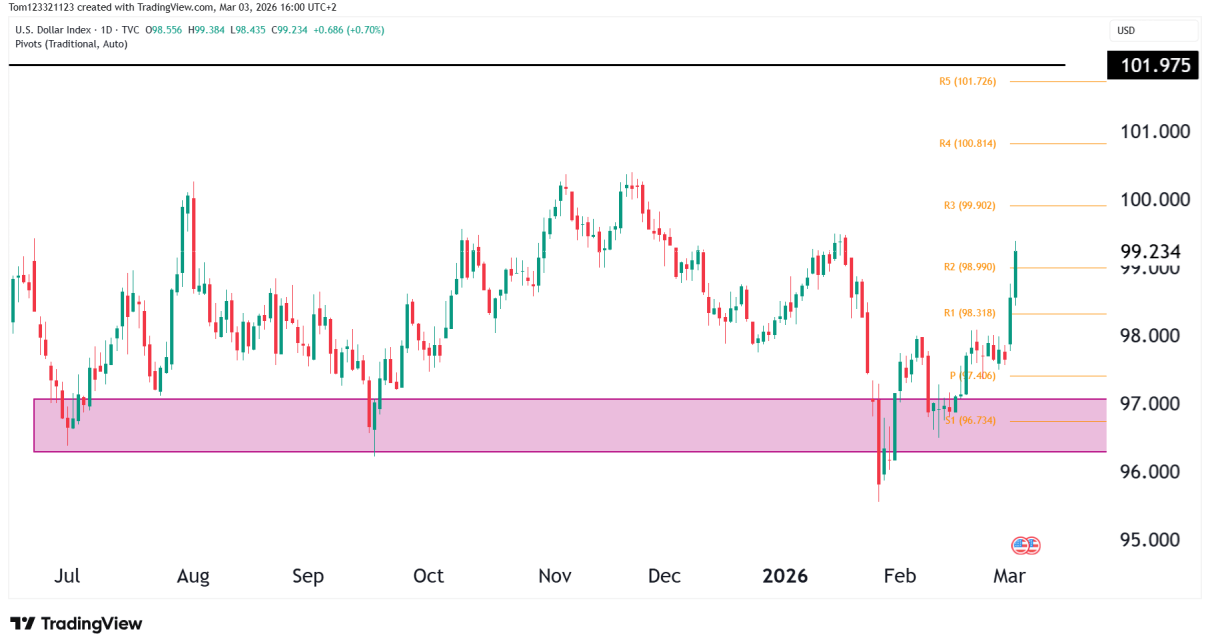
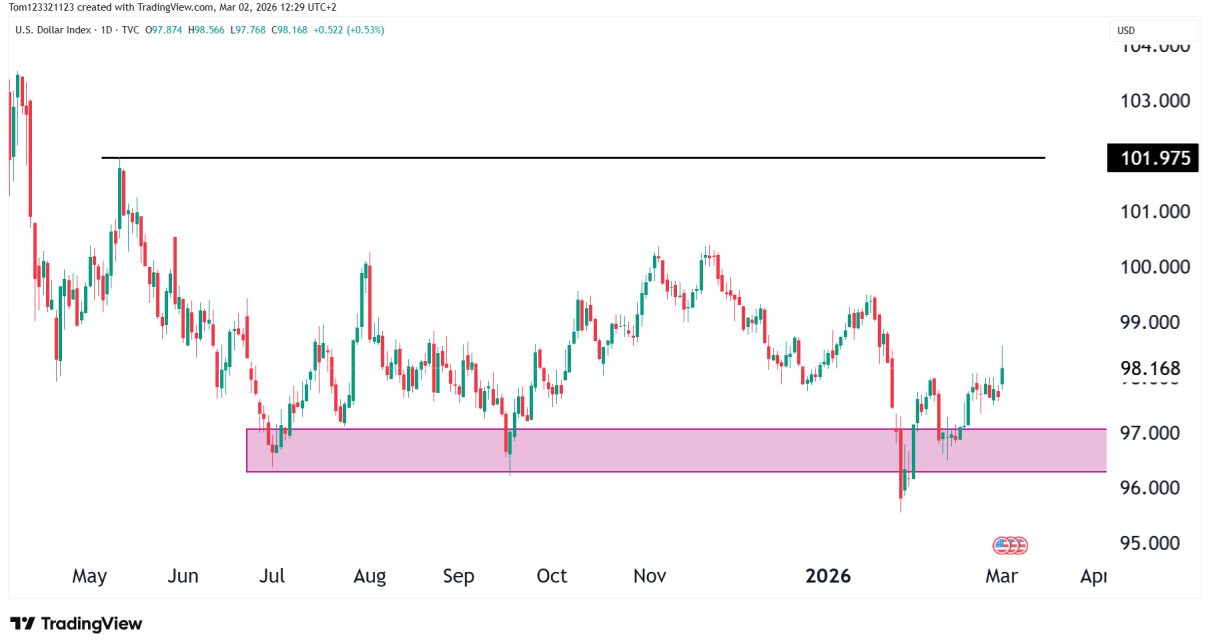
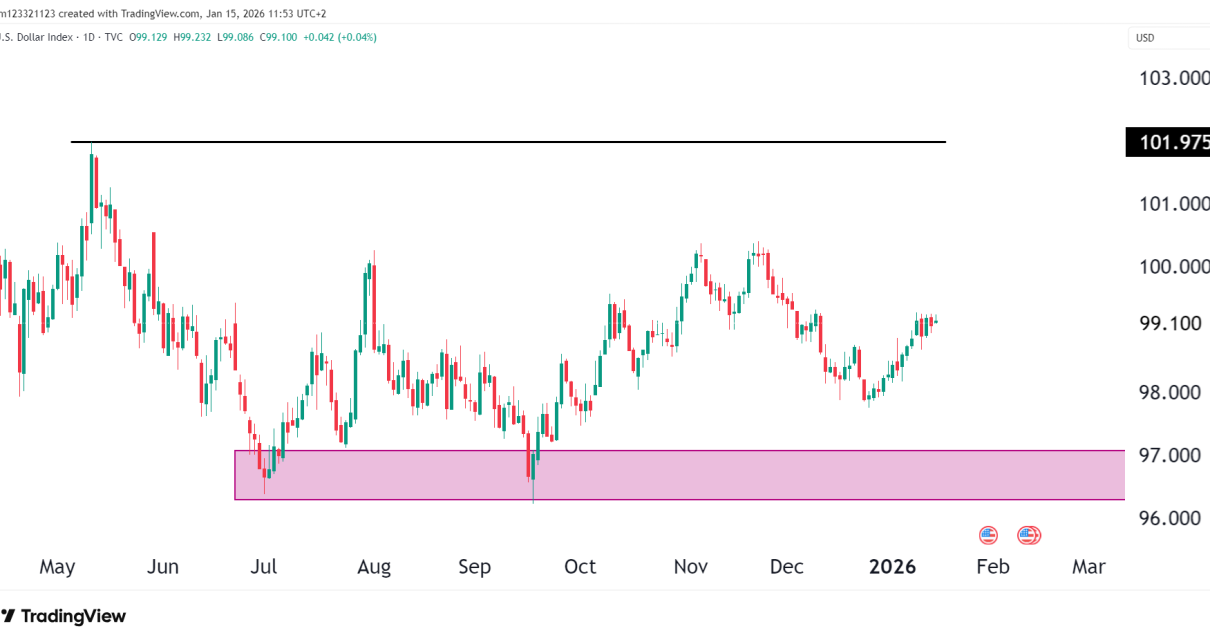
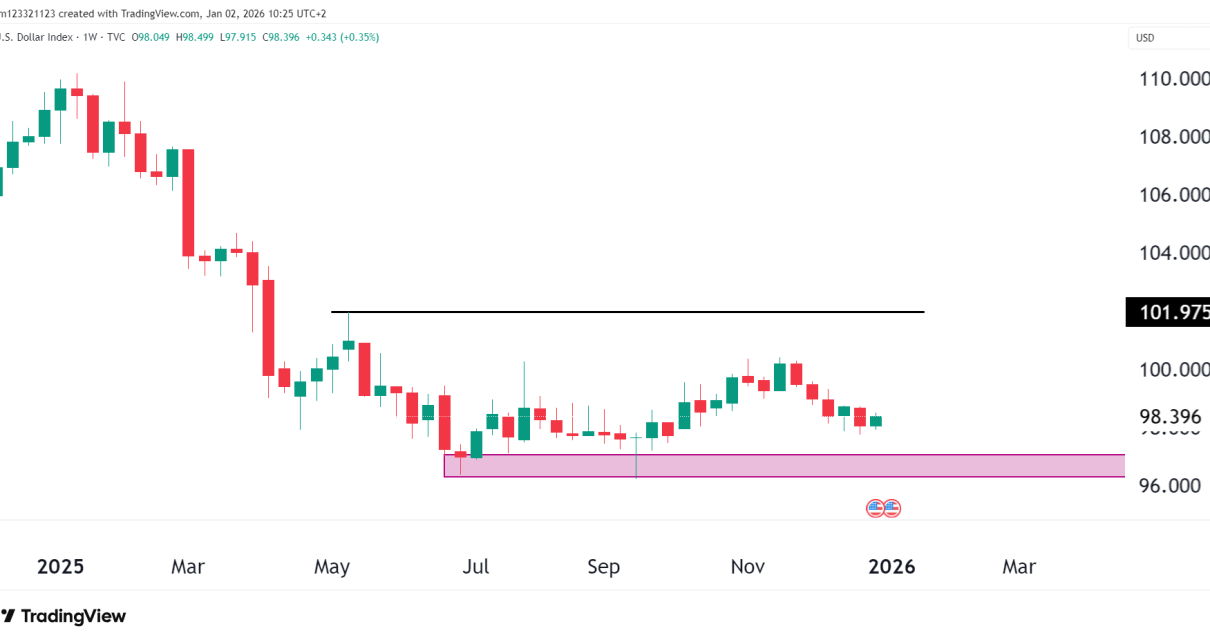
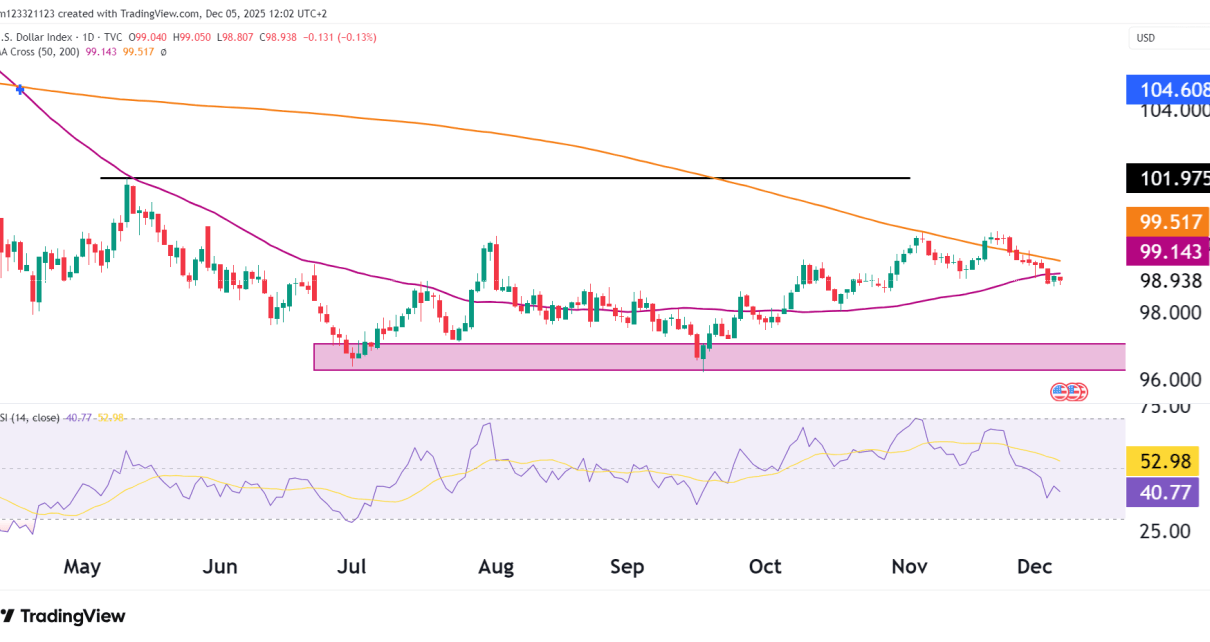
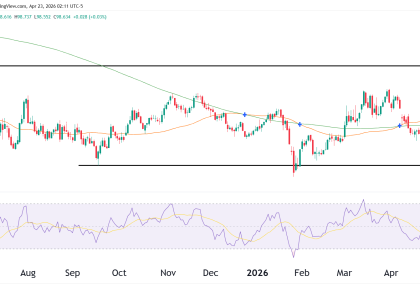
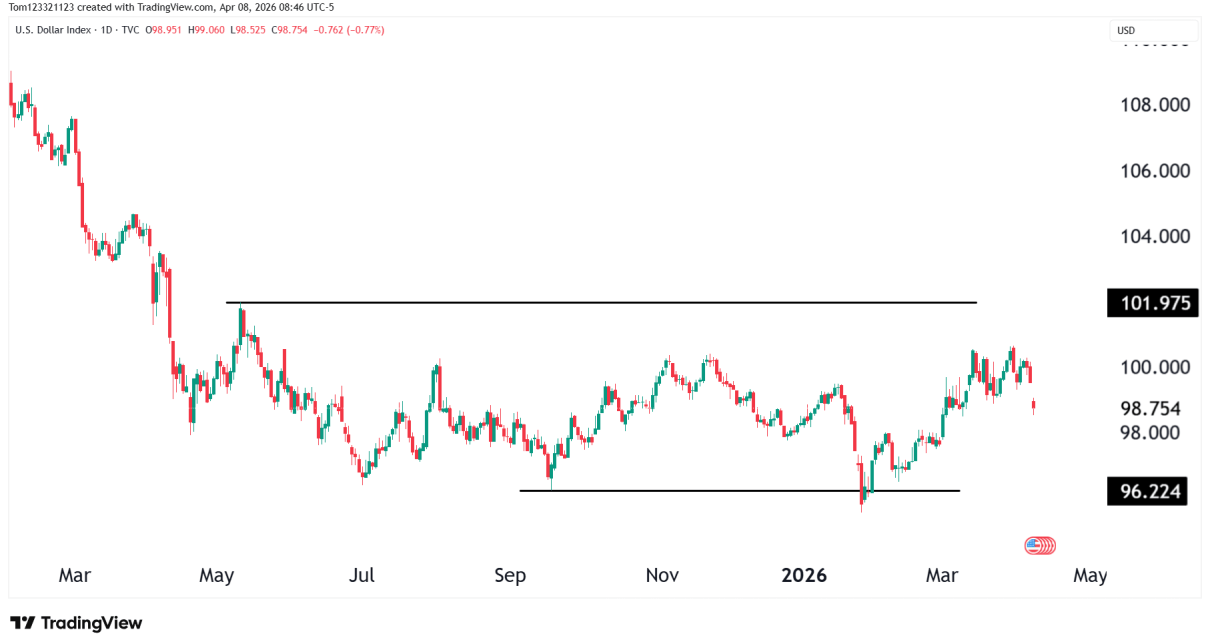
The chart provided displays the U.S. Dollar Index (DXY) on a weekly timeframe. Let’s analyze the technical indicators and identify potential bearish/short high-probability trade opportunities. Technical Analysis Descending Triangle Pattern: There is a symmetrical triangle formation. The price recently broke below the lower trendline of this triangle, signaling a potential continuation of the downtrend since Read More…
Tag: DXY
US Dollar Index (DXY) News & Technical Analysis
The decline in DXY: The DXY index has seen a recent decline, trading at around 105.125, primarily due to the strengthening of the euro and a weaker yen. The euro’s rise was driven by the results of France’s parliamentary elections, which alleviated concerns over aggressive fiscal policies and boosted European stocks and bonds (FX Empire). Read More…
Bulls hit first Dollar target, what now?
Weekly Chart Starting with the weekly chart, the Dollar has shown significant strength. Bulls have clearly taken control as indicated by the 4 weekly green closes in a row. We have successfully reached our first bullish target at 103.821, from our analysis last week. The current movement suggests that we could see further upside momentum, Read More…
Is The Dollar Diving Down?
Introduction The dollar is flat for the year after, at one point being down 4%, then swinging to the upside and gaining nearly 8% from the lows in July. The Fed’s stance indicates that we should see Dollar weakness, but what do the charts tell us? 1-Year Daily Chart Here is an improved version: The Read More…
Is It Time For The Dollar To Cool Off?
Introduction The Dollar has rallied 6% since July. This might not sound like a significant amount, but it is a significant move for a currency paired against a basket of other currencies. The DXY index topped out at 114.7 in September last year, then started falling and dropping to a low of 99.5 in July. Read More…
Dollar Tests Key Levels As Strength Continues
Dollar rallies into resistance zone The Dollar has been on a tear for the past two months, rallying 5% against a basket of currencies. That’s its greatest two-month performance since last year. Looking at the technicals, DXY is currently in a critical spot, trading within a resistance zone. Fundamentals and the macroeconomic environment have been Read More…