Chart Overview
Trendlines and Channel (BULLISH):
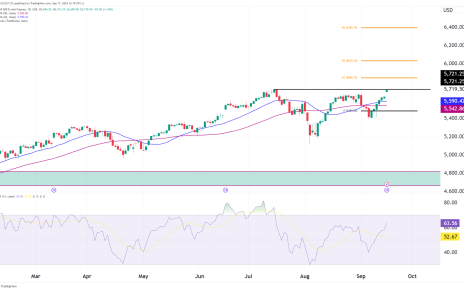
The chart shows a rising channel pattern. The price is bouncing between the top and bottom lines of the channel, and these lines are clear and strong.
Candlestick Analysis (BEARISH):
The recent candlesticks are a mix of green and red, and the latest one is a big red candle. This is telling us that bears are gaining strength, we need to be aware of this before we look for longs.
Pivot Points (Traditional, Auto):
The chart has pivot points marked as R1, R2, R3 for resistance and S1, S2, S3 for support. These help us find possible levels where the price might stop and change direction. Right now, the price is close to the R1 level at 2418.1 USD, which is the first resistance level to watch.
Moving Average:
The 21-day Simple Moving Average (SMA) seems to be acting as a moving support level. The price has broken below this level now
Relative Strength Index (RSI):
The RSI is at 47.01, which is slightly below the middle point of 50. This could mean that the price might be a bit weak in the short term. In general, an RSI reading near the middle of its range (around 50) suggests that the asset is neither overbought nor oversold. However, a reading slightly below 50, like 47.01, could indicate that the price might be a bit weak or losing some momentum in the short term.
Market Sentiment and Technical Outlook
- Short-term (1-2 weeks): The big red candle and the RSI under 50 suggest that the price might continue to pull back or move sideways in the short term, especially if it can’t break above the R1 level.
- Medium-term (1-3 months): The overall rising channel and the price being above the 21-day SMA show that the medium-term outlook is still positive. We need to watch if the price stays within the channel.
- Long-term (3-6 months): For the long term, a lot depends on the price staying in the rising channel. If the price keeps finding support from the SMA and pivot levels, it would be a good sign for the uptrend.
Potential Strategies
- Buying Opportunity: If the price stabilizes above R1 (2418.1) with more volume, it could be a signal to buy for a continued uptrend.