- Bulls have taken control as RTY breaks through the year-long trend line.
- Analyzing the DMI indicator and how it can help our decision-making.
- Potential pullback entries that can be taken on the 4 hourly chart.
Bulls Supreme
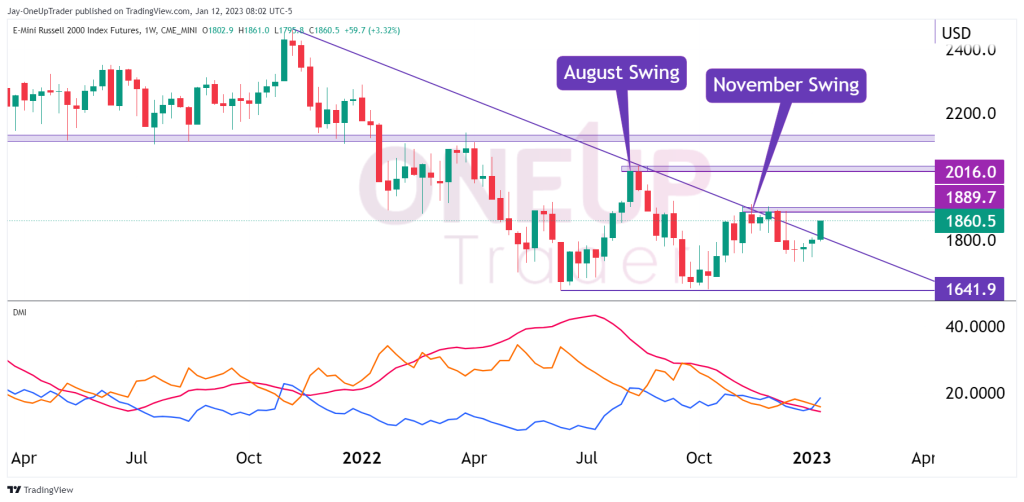
RTY futures have soared out of the year-long downtrend line that has kept the bearish momentum in most US indices. The Russell price attempted to make lower lows three times and has been unsuccessful. With three very bullish candlestick patterns on the weekly chart, and a possible confirmation closing this week, bulls appear to be in complete control.
Let’s analyze a few key levels and the directional movement index.
Key Levels – The most immediate level is at $1,889.7. It’s the November swing high. RTY is only trading a few points away from that, with the current price at $1,860.5. From there, the next bullish target would be $2,016, which is the August swing.
Directional Movement Index –
The Directional Movement Index (DMI) identifies the strength and direction of a trend. It consists of two lines: the +DMI (Blue) line and the -DMI line (Orange). The +DMI line measures the strength of the uptrend, while the -DMI line measures the strength of the downtrend. A third line, the ADX line (Red), is also plotted, which measures the strength of the trend (regardless of direction).
We can use the DMI to enter or exit trades based on the direction and strength of the trend. For example, if the +DMI line is above the -DMI line and the ADX line is rising, the uptrend is likely strong, and traders may enter a long position. Conversely, if the -DMI line is above the +DMI line and the ADX line is rising, it is likely that the downtrend is strong, and traders may enter a short position.
The +dmi blue line has just crossed above the orange and red lines, which hasn’t happened in over a year. This is a bullish sign, but it is still early days, and we need to see price rally toward the $2,016 level to confirm sentiment has shifted.
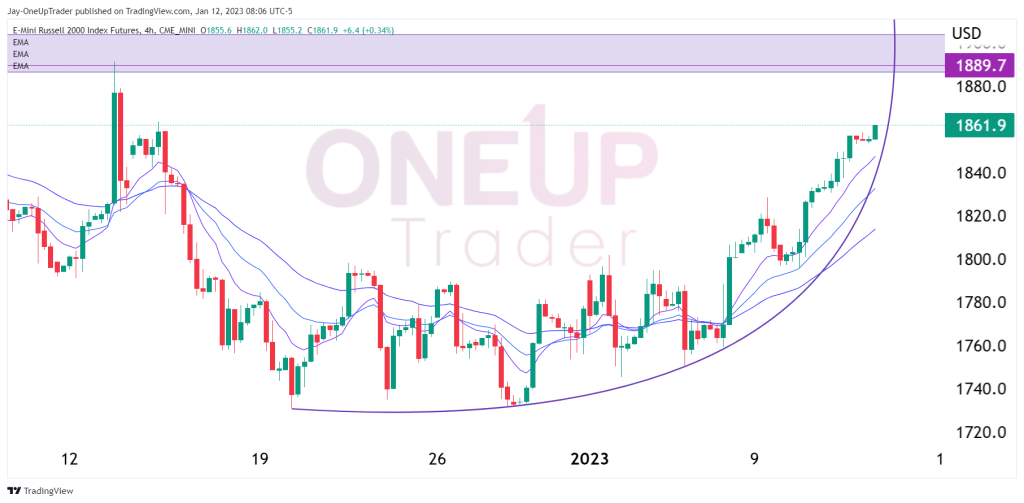
Pullback Entries
I have applied a 10, 20, and a 40 ema to the 4 hourly chart that could be potentially used as entry points. Even thought the trend is strong right now, does not mean it needs to be chased.