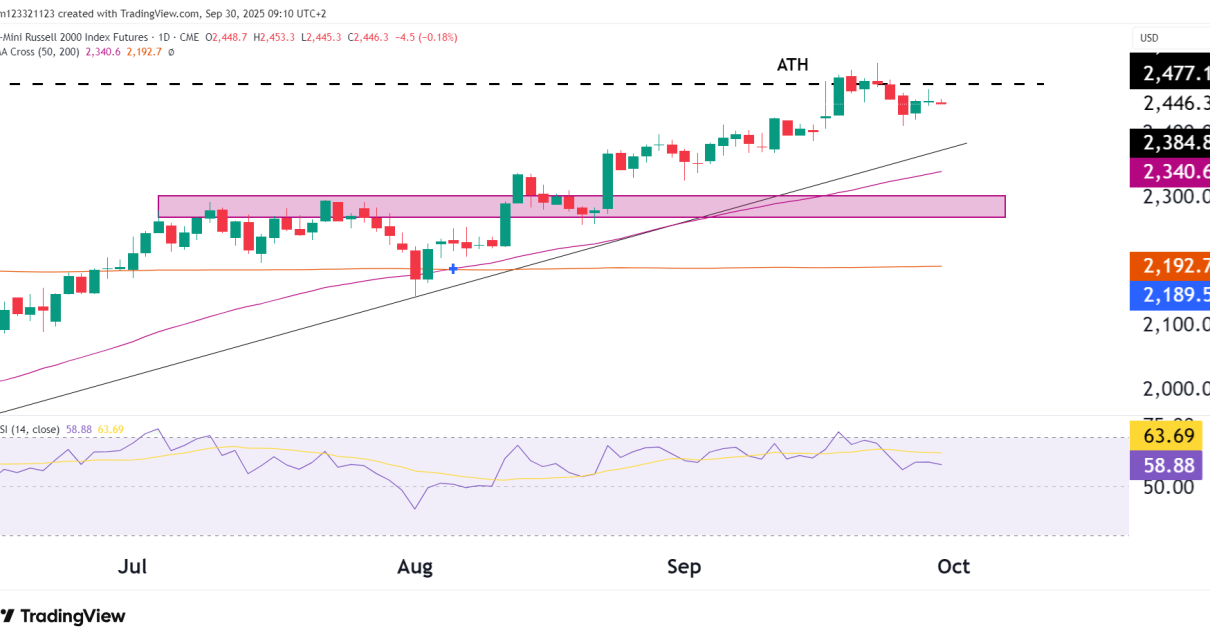
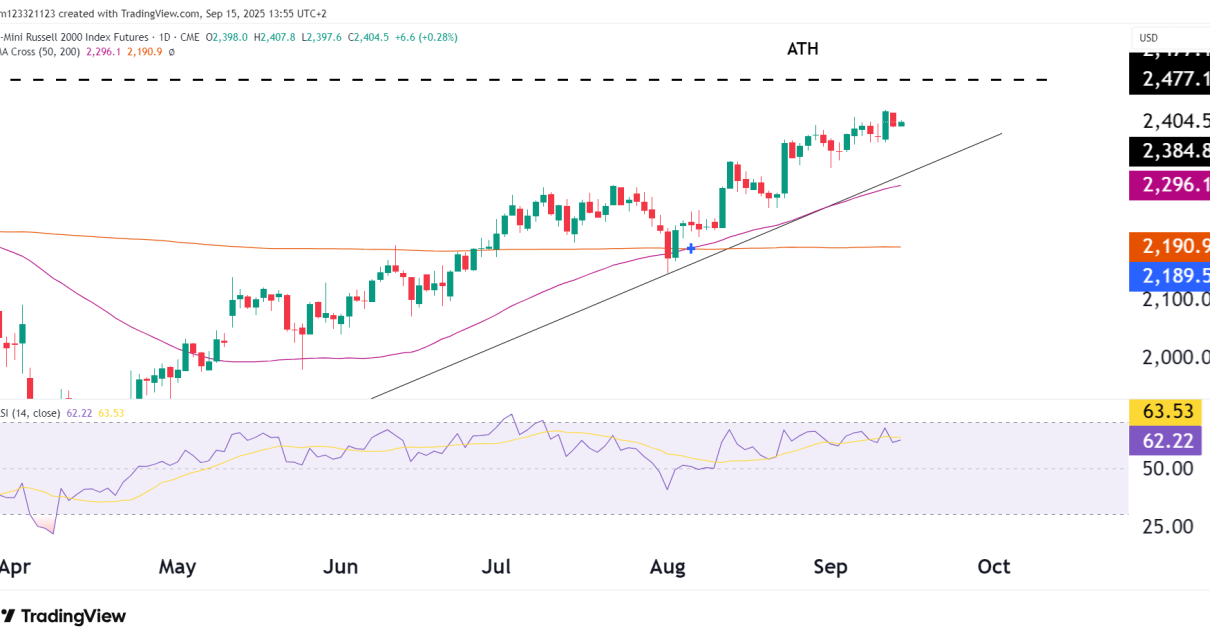
Technical Analysis

Converging Pattern spotted on Russell 2000 Futures (RTY)

Introduction: RTY has surged 22% since its lows in October last year, showcasing the strong bullish momentum. The upward-sloping 50-day moving average and an RSI of 62 reinforce equities’ optimistic outlook. Currently trading on the point of control line for the volume profile indicator, RTY faces a resistance zone just above the 2000 level, coinciding Read More…

Technical Analysis

Russell 2000 futures (RTY) overbought as euphoric bulls go all in

RTY stats The Russell is up 10% YTD and up 21% since the recent low made in October of last year. For the daily chart, technicals overall are bullish and are calling for buys only. The chart appears overbought, however, and the long trade might be a bit exhausted at this point, so let’s take Read More…

Technical Analysis

Russell 2000 futures (RTY) blast off as bulls take charge

RTY shoot through low volume nodes Bulls have completely taken control of RTY as it has rocketed 7% in four days. One of these reasons is that as RTY broke above $1,820, it entered into low-volume nodes all the way up to $1,873. Low-volume nodes have little liquidity, meaning price tends to break through them Read More…