- Price finds resistance at the year-long trend line once more.
- Yesterday’s session forms a bearish candle, but bulls appear to still be in control.
- Why the market rally we have seen recently is purely fundamental.
Year Long Trend Line Strikes Again
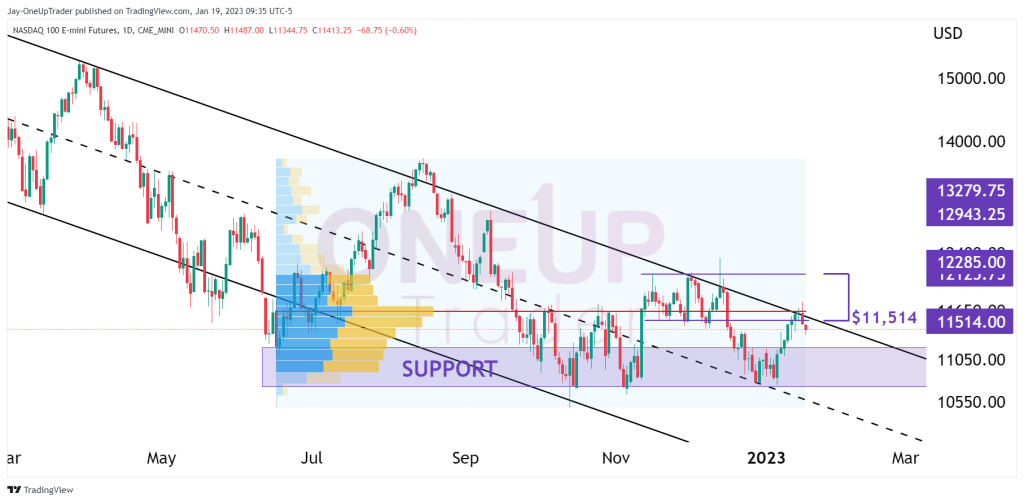
The trend channel we have discussed so many times in the technicals has proven to be an unstoppable force once more, as NQ reversed swiftly after testing in yesterday’s session, forming a bearish daily candle. The reversal point was also at the point of control line for the volume profile indicator adding to the selling pressure. As mentioned in yesterday’s article, fundamentals are currently creating some hope in the markets, which has resulted in indices rallying across the board.
Levels To Watch
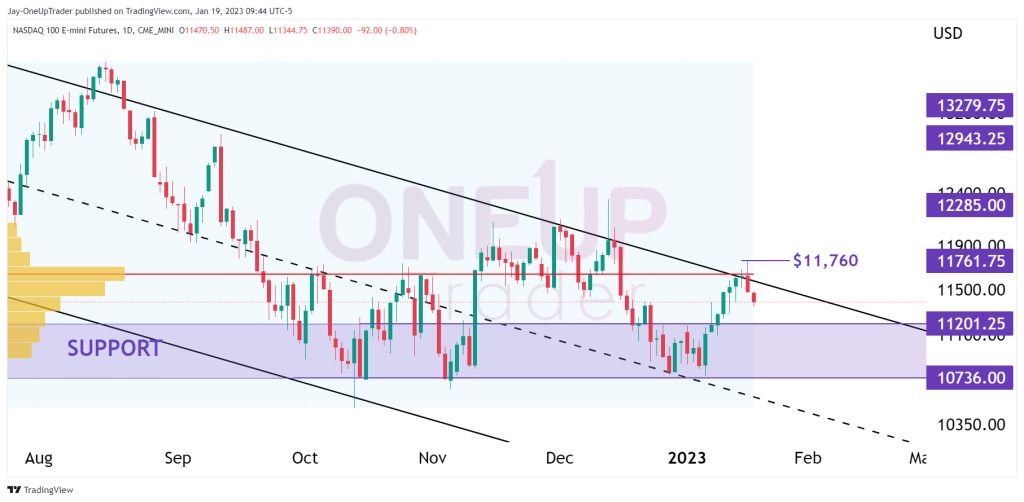
The high of yesterday’s candle is $11,760. A move above this level indicates the bulls are too strong even for the trend line and resistance of the point of control line. This would lead to a break above the trend line and means there could be a significant upside in the near term, especially if the Fed is hawkish in their comments later this month. Bearish targets would be $11,201.25 and $10,736.00, the wide support band that has held the price up since July of last year.
Things To Keep In Mind
The fundamentals and hope for a slowing down in interest rate policy is purely driving the rally in NQ. If Powell comes out and still thinks there is more room to go and tells the market that the current data is insufficient. This would affirm 2023 would still see high, strong interest rate rises. This is unlikely at the moment but still a slight possibility. It would send markets cratering.
Bulls are in control, and a break above the year-long trend line will likely lead to powerful price action to the upside in the medium term.