- The analysis looks at the daily chart and the consolidation period ZB is currently in.
- Bond buying lessens as risk on assets takes center stage.
Introduction
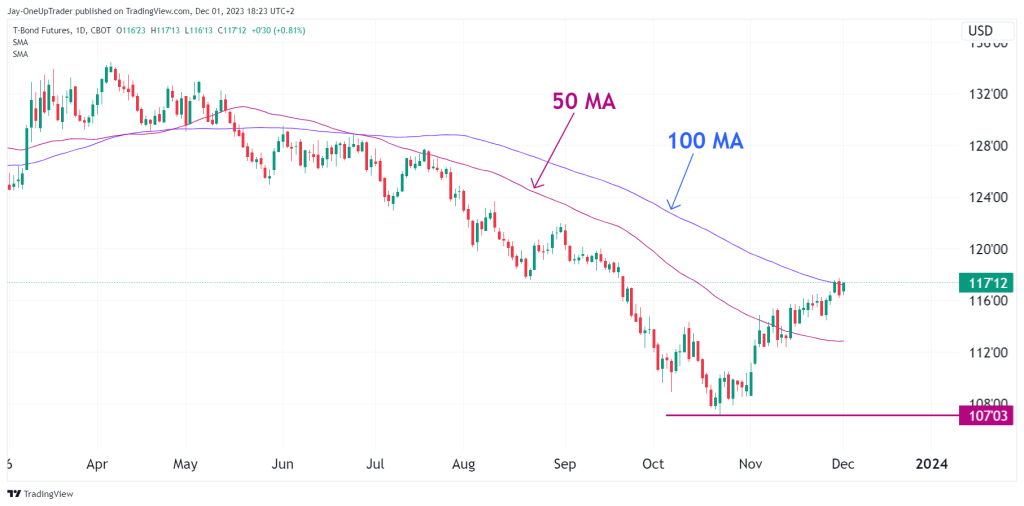
The T-Bond Futures (ZB) market exhibits a notable consolidation forming on the daily chart, with current price action gravitating towards the 50 and 100 moving averages, signaling potential shifts in market sentiment for the time being.
Daily Chart Analysis
It is clear that ZB has been a short sellers dream for the past few months as bond buying accelerated. Sentiment seems to be shifting however and the upward trajectory of prices indicates a potential change in trend. The moving averages are still sloping downward and the 50 is well below the 100 but as we predicted a few weeks ago, a consolidation phase is likely to ensue.
Key Levels to Watch
Immediate Support at 107’03: The price level of 107’03 stands as a significant support zone, where the market previously showed buying interest. A sustained price above this level may encourage continued bullish behavior.
Resistance Near 50 MA: The 50-day MA is the immediate resistance to watch. A decisive close above this moving average could attract further buying, shifting the intermediate trend to bullish.
Conclusion
The current T-Bond Futures landscape suggests a budding bullish momentum, with the market challenging the 50-day MA resistance. Traders should monitor the interaction with this MA, as a breakout could confirm a trend reversal. As always, maintain prudent risk management and adjust positions according to evolving market conditions.