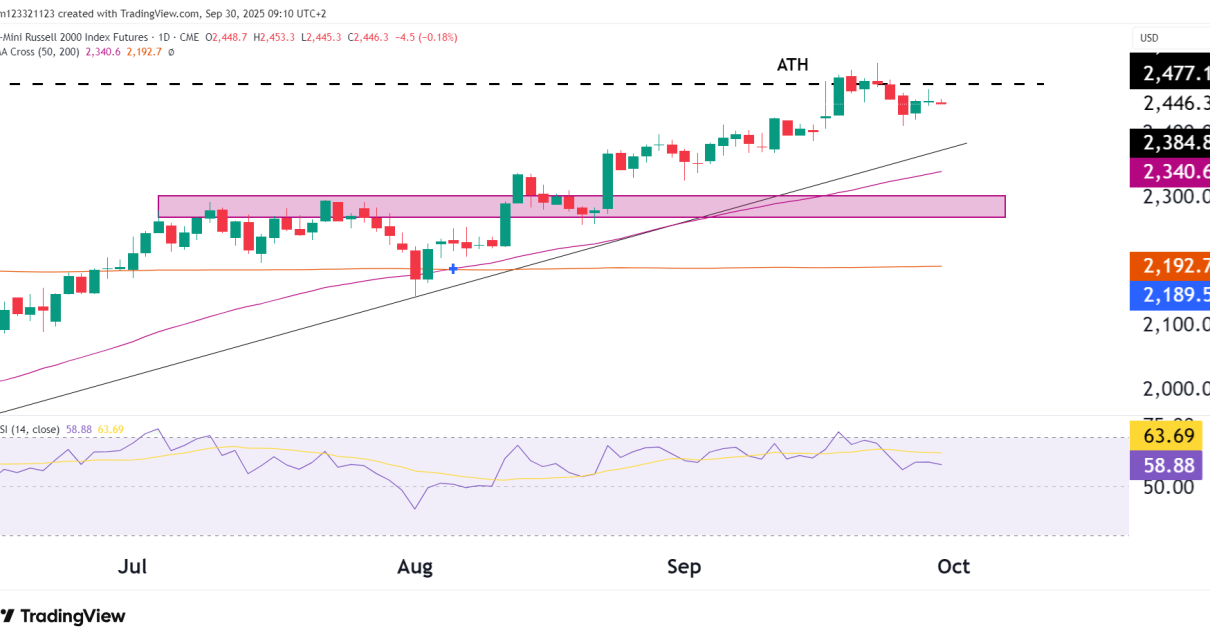
The Russell 2000 futures (RTY) have diverged strongly from major indices in 2023, with RTY down over 10% year-to-date while benchmarks like the S&P 500 post gains. RTY formed a symmetrical triangle consolidation pattern during most of 2022 that confined prices in a tight range. However, two weeks ago RTY broke decisively to the downside Read More…
Tag: rty
Is It Time To Buy The Russell 2000 Futures (RTY)
Technical Analysis The last time we looked at the Russell, it was falling toward a support level. This pattern is a converging technical pattern that we could look at taking positions from as it is a large range. You can see in the chart below, the support line we are looking at. What we would Read More…
Russell 2000 (RTY) plunges as bears take a firm grip
Recap We pick up from where we left off as RTY has continued to plunge after we suspected a potential triple top last week. The sell-off has accelerated and a likely cause of that is the volume profile point of control line. This aggressive selling could also be the result of the formation of a Read More…
Bears send Russell 2000 futures (RTY) tumbling
Recap In last weeks analysis of RTY, we saw that the Russell was at a critical point where it was testing the point of control line for the volume profile indicator, the 50% fib retracement, and a major resistance level. We knew that there would be a lot of buying pressure required in order for Read More…
Converging Pattern spotted on Russell 2000 Futures (RTY)
Introduction: RTY has surged 22% since its lows in October last year, showcasing the strong bullish momentum. The upward-sloping 50-day moving average and an RSI of 62 reinforce equities’ optimistic outlook. Currently trading on the point of control line for the volume profile indicator, RTY faces a resistance zone just above the 2000 level, coinciding Read More…
Russell 2000 futures (RTY) overbought as euphoric bulls go all in
RTY stats The Russell is up 10% YTD and up 21% since the recent low made in October of last year. For the daily chart, technicals overall are bullish and are calling for buys only. The chart appears overbought, however, and the long trade might be a bit exhausted at this point, so let’s take Read More…