Follow-Up: What Played Out Since July 31
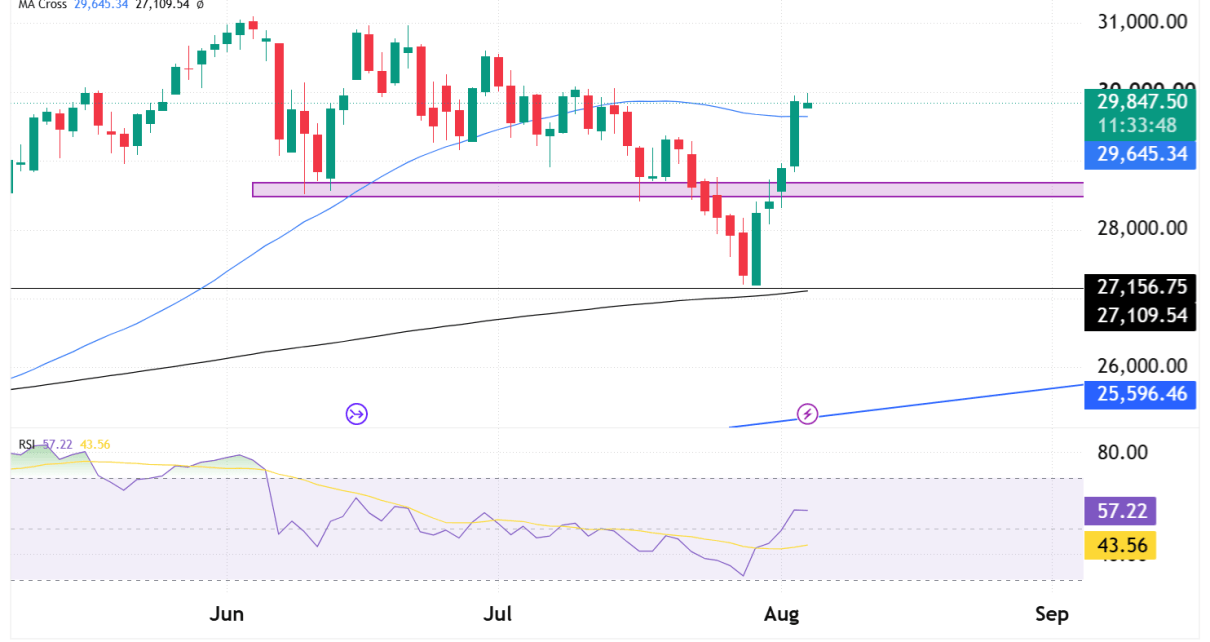
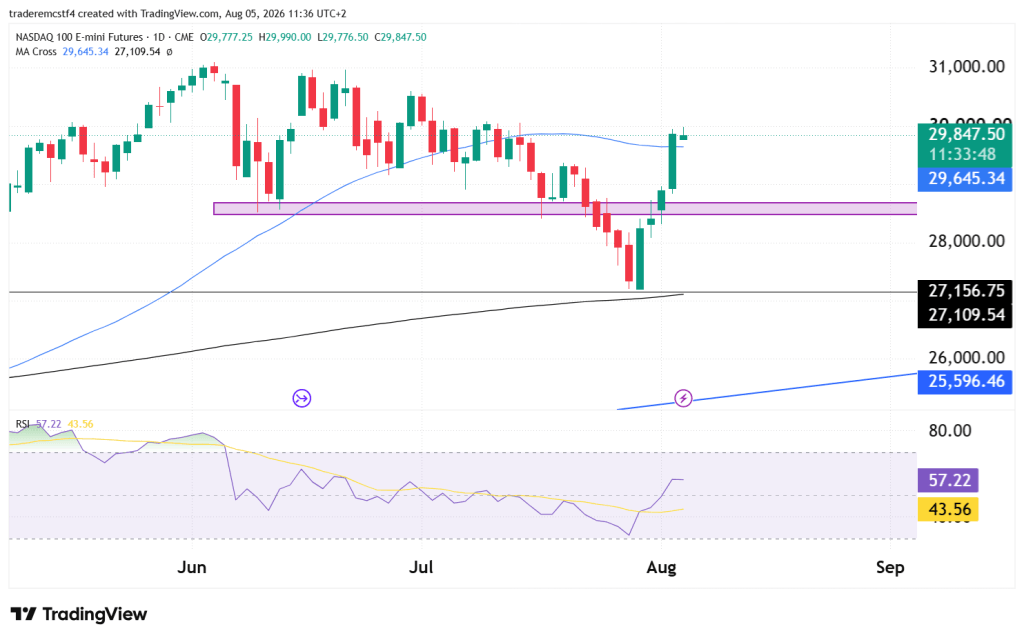
We need to take a look at Nasdaq again because of the recent rally we have seen, which is a very strong v reversal. For those who regularly follow the technical analysis we post on our blog, you would know we were watching the 27,156 level very closely on NQ because it was a multi year support/resistance level. Price tested it almost to the tick and reversed, giving us a 2,700 point rally in only 4 days.
The question now is whether there is enough strength for it to continue or it is overheated and we see a pullback before moving back toward the ATH.
The August 4 Rally, in Context
A few points worth flagging for readers:
- Strong earnings were a major driver. Palantir surged roughly 29-30% on what one report called “otherworldly” growth, and Caterpillar jumped over 5% on record quarterly revenue, both feeding risk appetite in growth and industrial names alike.
- Cooling Middle East tensions added a tailwind. Reports pointed to easing concerns around the Strait of Hormuz and a potential path toward a broader agreement, which helped push oil prices lower and reduced one of the market’s key inflation worries.
- The rally was broad rather than narrow. Advancing stocks outnumbered decliners by roughly 3-to-1 on the Nasdaq, and technology as a sector was reported up more than 4% on the day — this wasn’t just a handful of mega-caps carrying the index.
- Not every signal was unanimously bullish: AMD reportedly slipped in after-hours trading despite solid results, a reminder that AI-related earnings reactions are still being parsed stock by stock even within a broad rally.
Key Support and Resistance Levels
Major Resistance
| Level | Notes |
|---|---|
| 29,895 – 30,000 | Current level; also the ceiling of May’s distribution range before the summer correction |
| 30,300 | Mid-July lower high |
| 31,100 | Early June swing high, the year’s high so far |
Major Support
| Level | Notes |
|---|---|
| 29,646.31 | Faster moving average, now reclaimed and the first support on any pullback |
| 28,900 | Former resistance shelf, now the key level that needs to hold to keep the breakout intact |
| 27,109.78 | Slower moving average, the deeper trend-defining support |
Possible Trades
Bullish continuation
- Entry trigger: daily close above 30,000, confirming a break of the May range ceiling
- Stop: below 29,646
- Target: 30,300 initial, 31,100 extended
Pullback / fade scenario
- Entry trigger: daily close back below 29,646, signaling the rally is stalling into resistance
- Stop: above 30,000
- Target: 28,900 initial — a level that should hold if this is a genuine breakout rather than a false move
Invalidation / range scenario
- Continued chop between roughly 29,650 and 30,000 without a decisive close either side should be read as digestion after a fast two-day move, not a failed breakout
- A close back below 28,900 would be the first real sign the reclaim has failed
We Are Giving Away A Free Account On August 14th, Click Below To Find Out More!
Trading futures involves substantial risk of loss and is not suitable for all investors. Past performance is not indicative of future results. This analysis is for informational and educational purposes only and does not constitute financial advice. Nothing in this article should be construed as a recommendation to buy or sell any security or financial instrument. Always conduct your own due diligence and consult with a licensed financial advisor before making any trading decisions.