Reading time: 3 minutes
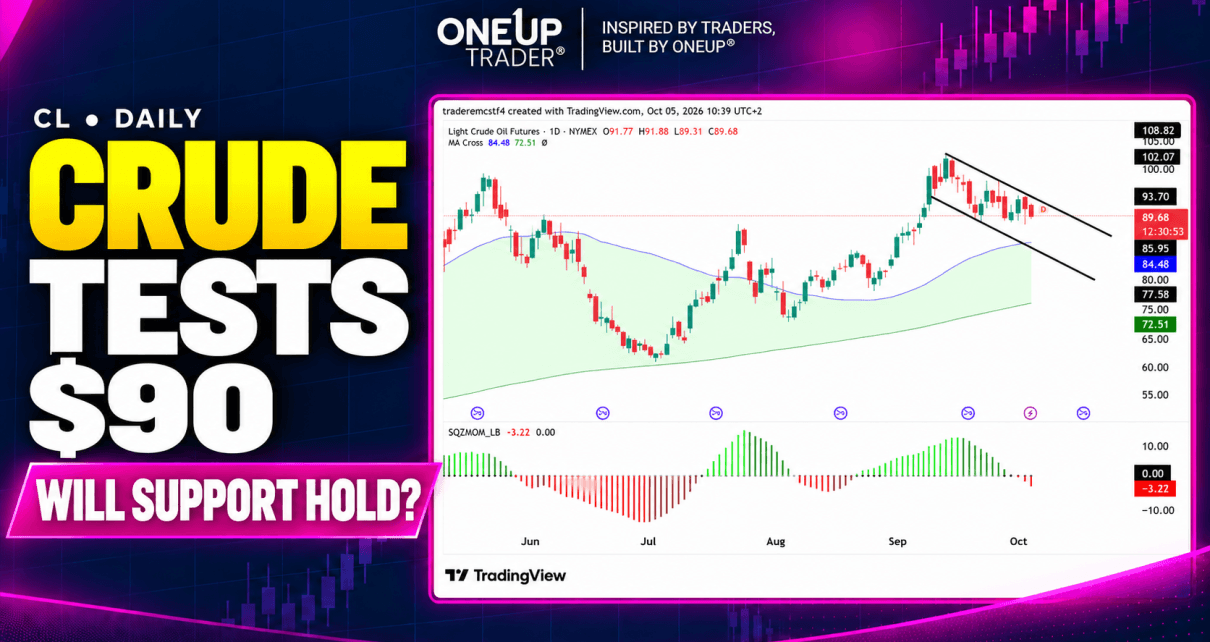
In our September 23 analysis, we were watching whether crude oil could hold $89–$90 and recover above $92–$93. Buyers have repeatedly come back into the market near support, but those rebounds have not ended the correction just yet. The market is still making lower highs beneath September’s peak. This is not uncommon after the 50% rally we saw since the beginning of August.
First, let’s take a look at the important levels to mark on the chart, and then we can see if there are any trades we can take.
| Level | Importance |
|---|---|
| $100–$102 | September peak and major resistance |
| $95–$97 | Previous trading area above the channel |
| $92–$94 | Recent rebound highs and descending channel resistance |
| $89–$90 | Immediate support under repeated pressure |
| $86–$88 | Next support area if the recent lows give way |
| $84–$85 | Rising blue moving average, currently $84.48 |
The descending channel is the clearest feature of the daily chart. Since the September high near $102, each recovery has run into selling at a lower level. It is starting to resemble a bull flag, which means if we can see price clear and close above $96.50 then we could see the next bull leg continue.
The difficulty with trading crude oil right now is that it’s very dependent on the conflicts in the Middle East; it can easily lose or gain $10 in a single session based on anything Donald Trump says or a development regarding the Strait of Hormuz. So if you are trading CL, keep this in mind because the volatility can skyrocket in the blink of an eye.
Join The OneUp Trader Discord To Receive a 20% Discount Code!
For traders, the next useful developments are:
- A sustained recovery above $92–$94. This would challenge the channel and recent lower highs. Holding that area on a pullback would bring $95–$97 into focus, followed by $100–$102. A brief move above the trendline that closes back inside the channel would offer weaker confirmation.
- A daily close below $89 followed by a failed recovery. This would strengthen the case for a move toward $86–$88. Selling immediately into that next support area leaves less room before another possible buying response.
- A deeper test of $84–$85. The rising blue moving average makes this an important reference for the broader recovery. A reversal there would need price confirmation, such as a higher low and a break above the rebound high. Touching the average alone would not establish support.
The most useful change from our previous analysis is that the pullback now has a defined channel and negative momentum. $89–$90 remains the immediate decision area, while $92–$94 is the recovery test. Until one gives way with follow-through, traders are dealing with a correction that has repeatedly interrupted rebounds.
This analysis is for educational and informational purposes only and does not constitute trading advice or a recommendation to buy or sell any futures contracts. Futures trading involves significant risk and may not be suitable for all investors. Always conduct your own research and consult with a licensed financial professional before making trading decisions.