

- Discover potential trading opportunities in T-Bond Futures (ZB) as the market exhibits relatively flat price action on the daily chart.
- The Accumulation/Distribution Line (ADL) registers at 1400, suggesting a higher chance for the bullish case.
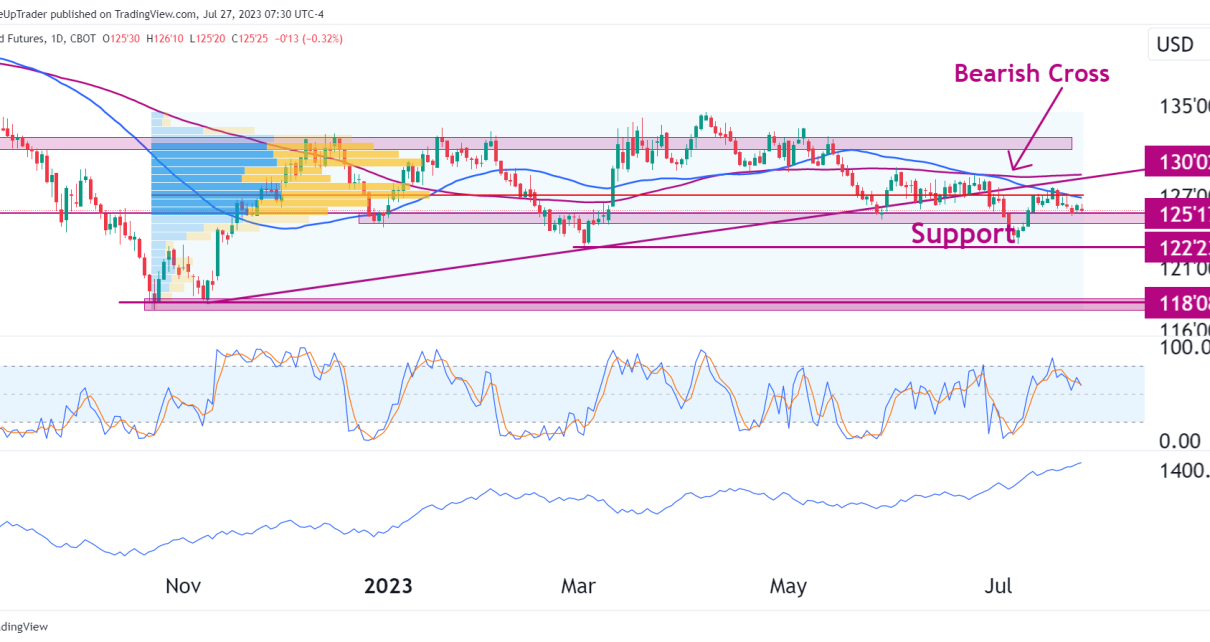
- T-Bond Futures (ZB) trade inside a high volume node, with the point of control line only 1% above the current price.
Introduction:
Based on the daily chart, this technical analysis of T-Bond Futures (ZB) will examine the recent price movement, key technical indicators, and potential trading opportunities. Throughout the year, ZB has experienced relatively flat price action, lacking a clear trend. The 50-day moving average sloping downward and the price trading below it suggests the presence of strong bearish momentum. The stochastic oscillator at 60 indicates a balanced market sentiment. While the Accumulation/Distribution Line (ADL) stands at 1400, suggesting increased buying pressure, the price is currently trading inside a high volume node according to the volume profile indicator. Notably, a significant chart pattern, the ascending triangle, failed to result in a clear directional breakout. However, despite the lack of a strong trend, the analysis suggests a higher likelihood of the bullish case over the bearish case.
Technical Analysis:
- Sideways Movement: T-Bond Futures (ZB) have displayed relatively flat price action throughout the year, indicating a lack of a clear trend. This range-bound behavior may provide potential trading opportunities, especially if a breakout occurs.
- Moving Averages: The 50-day moving average (MA) sloping downward and the price trading below it indicate strong bearish momentum. The presence of this resistance from the moving average may act as a barrier to any potential upside moves.
- Stochastic Oscillator: With the stochastic oscillator at 60, ZB’s market sentiment is balanced, suggesting that the price is not currently overbought or oversold.
- Accumulation/Distribution Line (ADL): The ADL standing at 1400 indicates increased buying pressure, implying that there may be a greater likelihood of buyers stepping into the market at these levels.
- Volume Profile: The price is currently trading inside a high volume node, according to the volume profile indicator. The point of control line, which represents the price level with the highest trading activity, is only 1% above the current price. This indicates that the market is currently in a state of equilibrium, with a balanced level of supply and demand.
- Support Zone: A support zone is observed just below the current price, around 125. This area may act as a potential floor for the price, providing support against further downward movements.
- Ascending Triangle Pattern: A significant chart pattern, the ascending triangle, formed on the chart. However, the breakout from this pattern was sideways, without a clear directional bias. This indecisive breakout adds to the uncertainty in the market.

Trading Opportunity:
Given the lack of a significant trend on the daily chart, traders should be cautious in their approach. However, there appears to be a higher chance for the bullish case than the bearish case, considering the following factors:
- The ADL’s indication of increased buying pressure suggests that buyers may step in at these levels, potentially supporting the price.
- The price is currently trading inside a high-volume node, which further reinforces the idea of an equilibrium market and the potential for price stabilization.
- The presence of a support zone just below the current price (around 125) may act as a barrier against further downside moves.
With these factors in mind, traders might consider looking for potential long positions near the support zone or on any breakout above the high-volume node. However, it’s important to implement proper risk management and closely monitor price action for confirmation of a new bullish trend.
Ending Off:
T-Bond Futures (ZB) have shown relatively flat price action throughout the year, lacking a significant trend. Despite the presence of a downward-sloping 50-day moving average and the sideways breakout from the ascending triangle pattern, the analysis suggests a higher chance for the bullish case. Increased buying pressure, a high volume node, and a support zone around 125 contribute to this outlook. As always, traders should exercise caution, implement proper risk management strategies, and closely observe price action for any potential breakout or trend confirmation.
